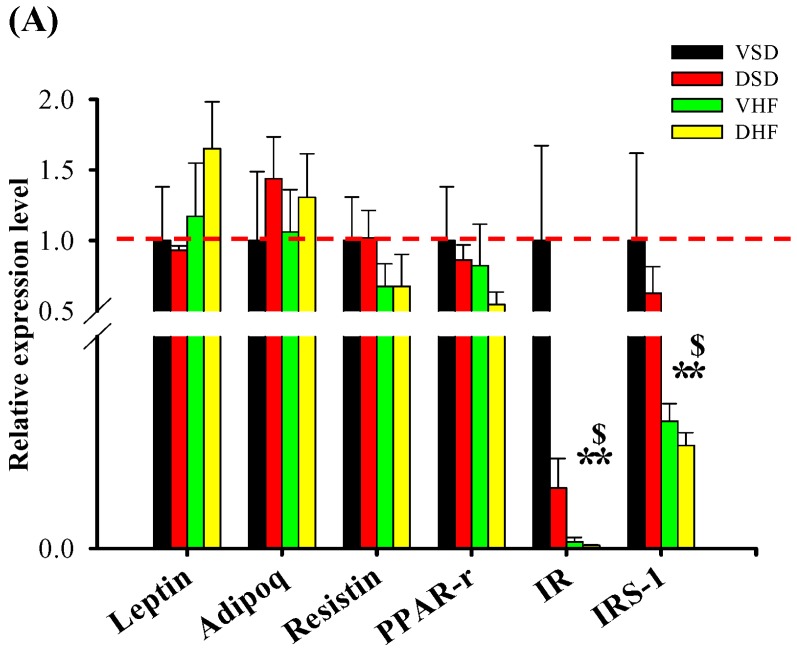
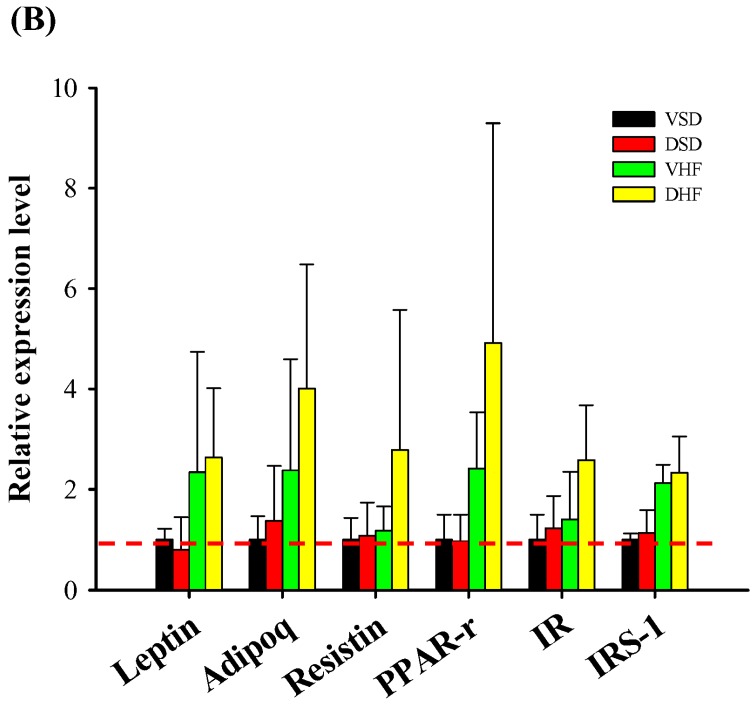
Figure 6.
Adipose mRNA transcript levels: (A) epididymal fat; and (B) omentum fat. The red dotted line represented that the relative gene expression was 1 when compared to VSD group. PPAR-r, Peroxisome proliferator-activated receptor gamma. Data were compared by two-way ANOVA with post hoc least significant difference followed by LSD tests. * vs. VSD, p < 0.05; $, DSD vs. DHF , p < 0.05.


