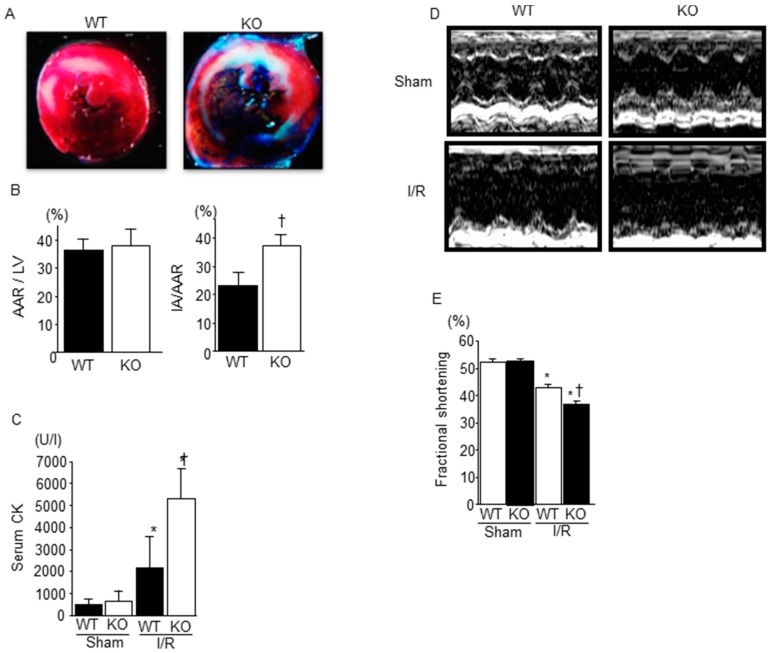
Figure 1.
Comparison of myocardial I/R injury between WT and SMP30 KO miceL (A) Representative photomicrographs of Evans blue/TTC-stained hearts obtained from WT and SMP30 KO mice subjected to 30 min of ischemia and 24 h of reperfusion. The TTC red-stained area indicates AAR and the unstained area indicates IA; (B) Quantitative analysis of AAR/LV and IA/AAR. Graphs show mean ± SE of AAR/LV and IA/AAR (n = 7). † p < 0.05 vs. WT I/R mice; (C) Serum CPK levels 24 h after I/R or sham operation in WT mice and SMP30 KO mice. Graphs show mean ± SE of serum CPK levels (n = 7). I/R, ischemia/reperfusion; AAR, area at risk; IA, infarct area; CPK, creatine phosphokinase. * p < 0.05 vs. sham-operated mice, † p < 0.05 vs. WT I/R mice; (D) Representative M-mode echocardiograms of left ventricles in WT and SMP30 KO mice 24 h after I/R and sham operation; (E) Fractional shortening 24 h after I/R or sham operation in WT mice and SMP30 KO mice. Graphs show mean ± SE of fractional shortening (n = 10 to 15). * p < 0.05 vs. sham-operated mice, † p < 0.05 vs. WT I/R mice.

