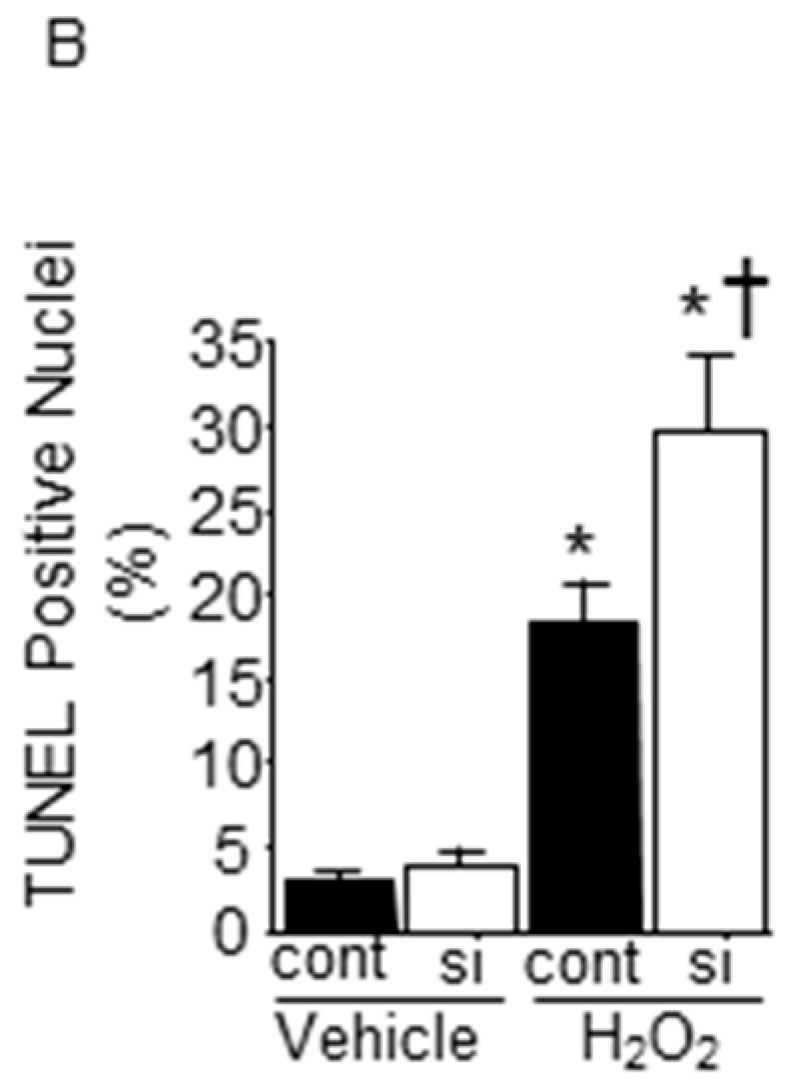
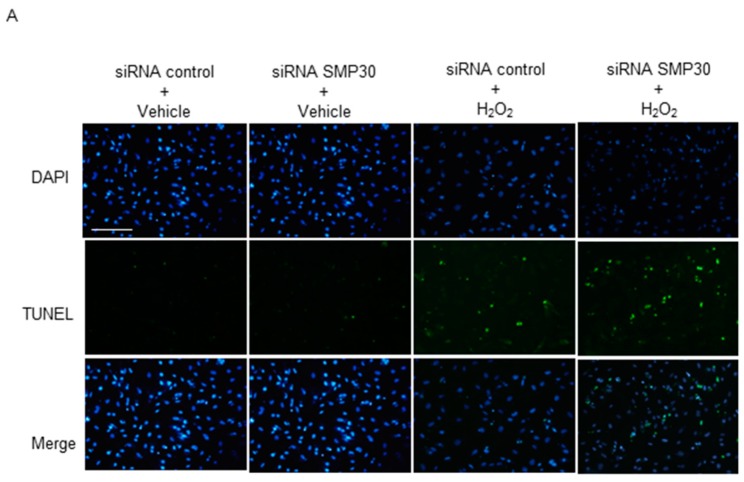
Figure 6.

Evaluation of apoptosis induced by H2O2 stimulation in vitro: (A) representative TUNEL stained sections from SMP30 siRNA and control siRNA cardiomyocytes subjected to 24 h of H2O2 stimulation; (B) percentages of TUNEL-positive nuclei in sections. Data are represented as mean ± SE (n = 6), Scale bars: 200 μm, * p < 0.05 vs. vehicle control siRNA, and † p < 0.05 vs. H2O2 control siRNA.

