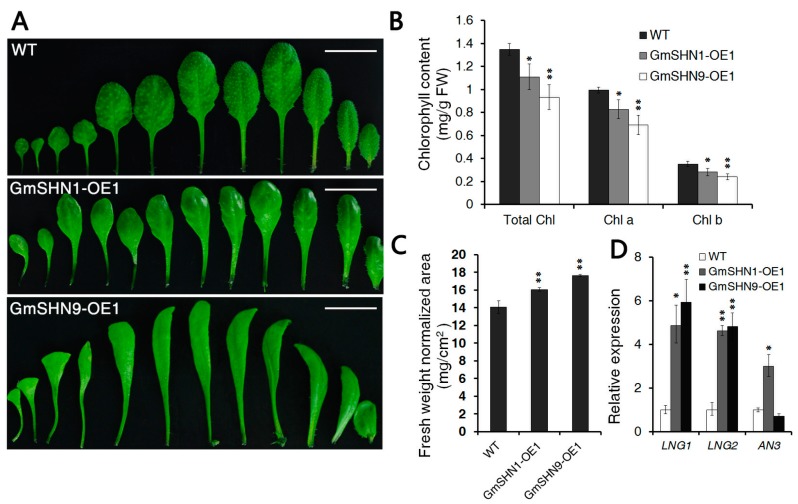
Figure 5.
Morphological and biological analysis of transgenic plants. (A) Anatomy analysis of 4-week-old Arabidopsis rosette leaves of WT, GmSHN1-OE1 and GmSHN9-OE1. GmSHN1-OE1 had smaller leaves, and GmSHN9-OE1 exhibited yellow-green, longer, and more slender leaves. We performed three independent assays and received similar results each time; (B) Analysis of total chlorophyll (total Chl), chlorophyll a (Chl a) and chlorophyll b (Chl b) in GmSHN1-OE1, GmSHN9-OE1, and WT leaves. Presented values are means from three independent replicates (±SD); (C) Analysis of leaf fresh weight normalized area of GmSHN1-OE1, GmSHN9-OE1, and WT. Leaf fresh weight normalized area (mg/cm2) increased 14% in GmSHN1-OE1 and 25% in GmSHN9-OE1. The data are given as mean values with ±SD (n = 3); (D) Expression of leaf development related genes. Expression levels of genes in WT were taken as 1. The Arabidopsis ACT2 gene was used as the internal control for normalization of the template cDNAs. The results are given as mean values of three replicates, and error bars represent SD (n = 3). * p < 0.05, ** p < 0.01 vs. WT with two tailed Student’s t test.

