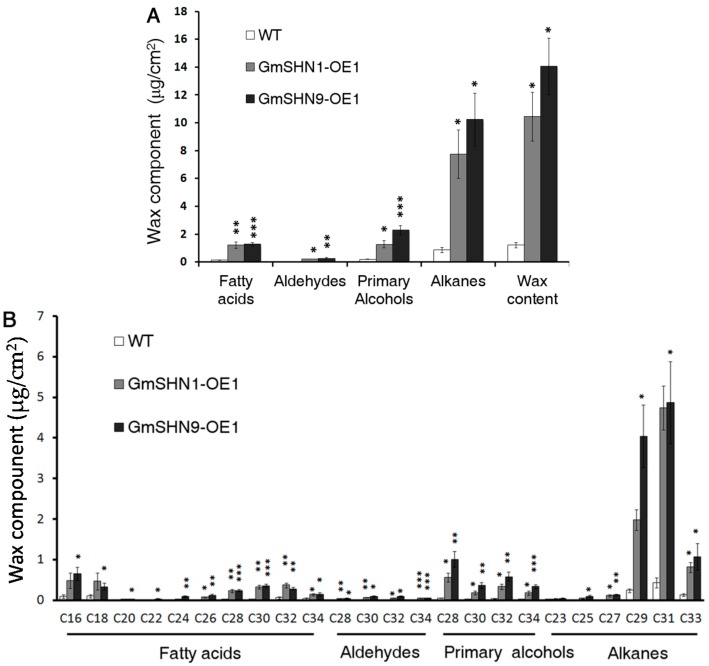
Figure 8.
Analysis of leaf cuticular wax contents and components of GmSHN1-OE1, GmSHN9-OE1, and WT. (A) Quantitative analysis of wax contents and components in Arabidopsis leaves; (B) Quantitative analysis of constituents of fatty acids, aldehydes, primary alcohols, and alkanes in Arabidopsis leaves. The results are given as mean values with ±SD (n = 4). Significance levels between WT, GmSHN1-OE1, and GmSHN9-OE1 were assessed by Student’s t test (* p < 0.05, ** p < 0.01, *** p < 0.001).

