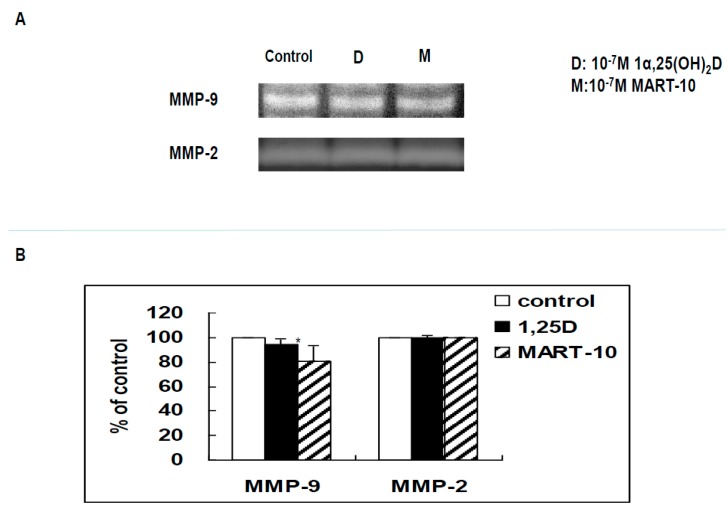
Figure 8.
Effects of 1α,25(OH)2D3 and MART-10 on the activities of MMP-2 and MMP-9 in MDA-MB-231 cells. (A) MMP-2 and MMP-9 activity was analyzed by zymography. After two days of treatment with 10−7 M 1α,25(OH)2D3 or MART-10, conditioned media were collected for activity assay. The white bands represented the digested areas corresponding to the activities of MMP-2 and MMP-9; (B) Quantitative analysis of MMP-2 and MMP-9 activities. Each value was a mean ± SD of three independent determinations (* p < 0.05).

