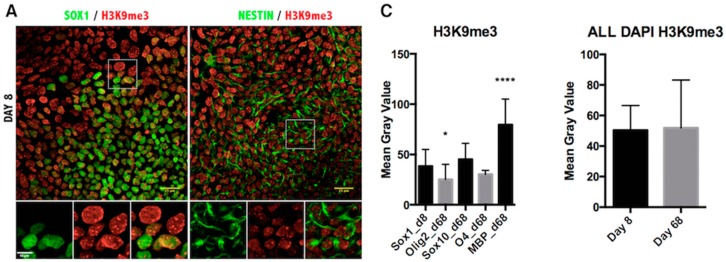
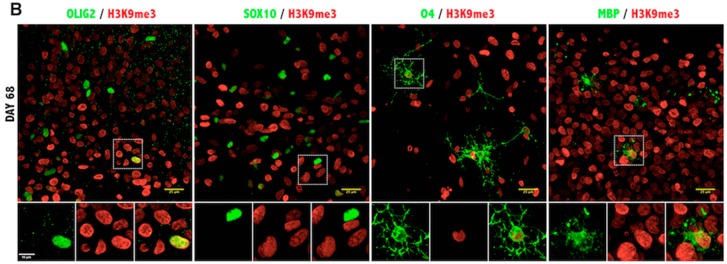
Figure 5.
Immunofluorescence analysis of histone H3 lysine 9 trimethylation in iPSC-derived oligodendrocyte lineage cells. (A) Representative images of Day 8 of the oligodendrocyte differentiation protocol co-stained for NSC markers SOX1, NESTIN and the H3K9me3 antibody; (B) Images from Day 68 of differentiation co-stained for oligodendrocyte markers OLIG2, SOX10, O4, MBP and H3K9me3 antibody. Scale bar = 25 μm. The magnified view of the broken line box area appears as the inset with the individual channels and the merged image. Scale bar = 10 μm; (C) Quantitation of the immunofluorescence signal as the mean gray value in cells expressing the indicated markers (left) or in all DAPI-positive cells per field (right). Results are represented as the mean with the SD. * p < 0.05; **** p < 0.0001.


