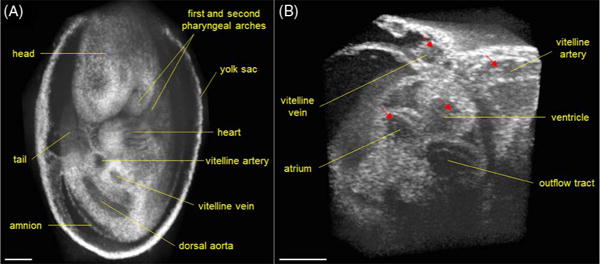
Fig. 2.

(A) Large-field 3D OCT image of E9.5 mouse embryo obtained with slow galvanometer mirror scanning. (B) 4D cardiodynamics of E9.5 mouse embryo obtained from direct time-lapse 3D imaging with a volume acquisition rate of ~43 Hz (Visualization 1). Arrows indicate the blood cells. Scale bars = 300 μm.
