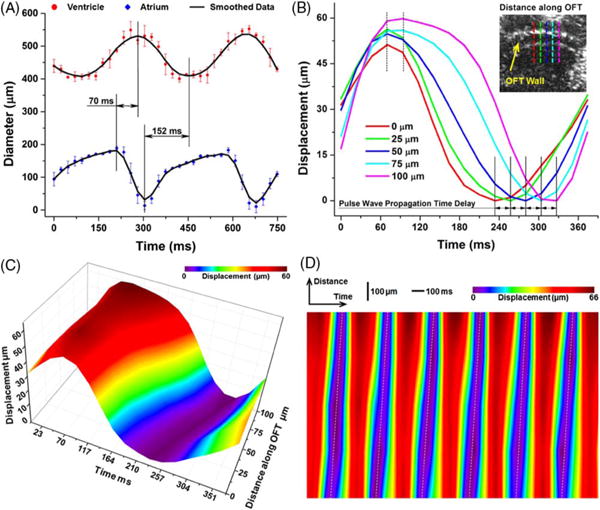
Fig. 3.

(A) Inner diameters of heart tube over time showing phase delay between the beating atrium and ventricle in E9.5 mouse embryo. Data points represent mean and standard deviation quantified from three heartbeat cycles. (B) Localized displacement from OFT wall over time at five select locations showing time delay of the wall motion. The OCT image with dashed lines shows OFT wall positions used for measurements. (C) Movement of OFT wall over one heartbeat cycle showing pulse wave propagation. (D) Displacement of OFT wall over both time and distance for six continuous heartbeats.
