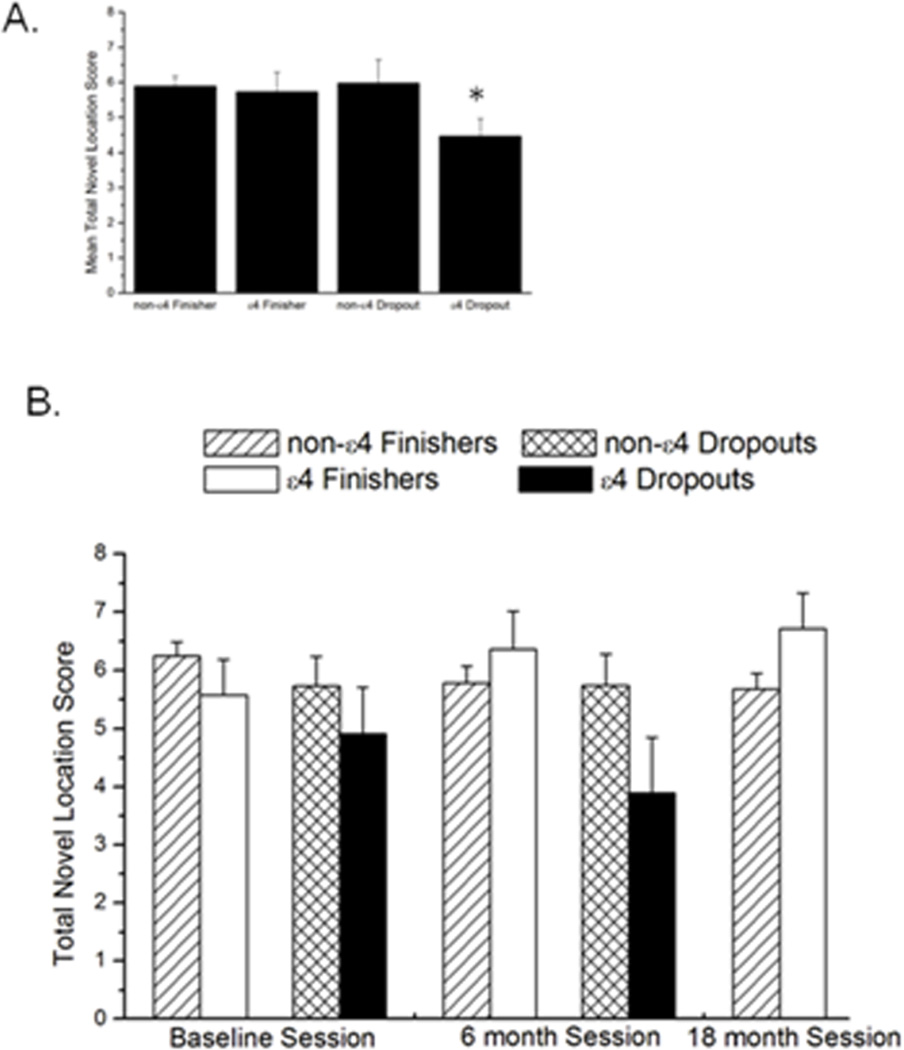
Figure 4.
A. Inset shows average ‘novel location’ (NL) sub-scores over all three sessions. B. Total novel location (NL) sub-scores in the 3 individual sessions. In dropouts and finishers, there was a genotype × session interaction. * indicates a significantly lower collapsed score over time at P < 0.05. n = 114

