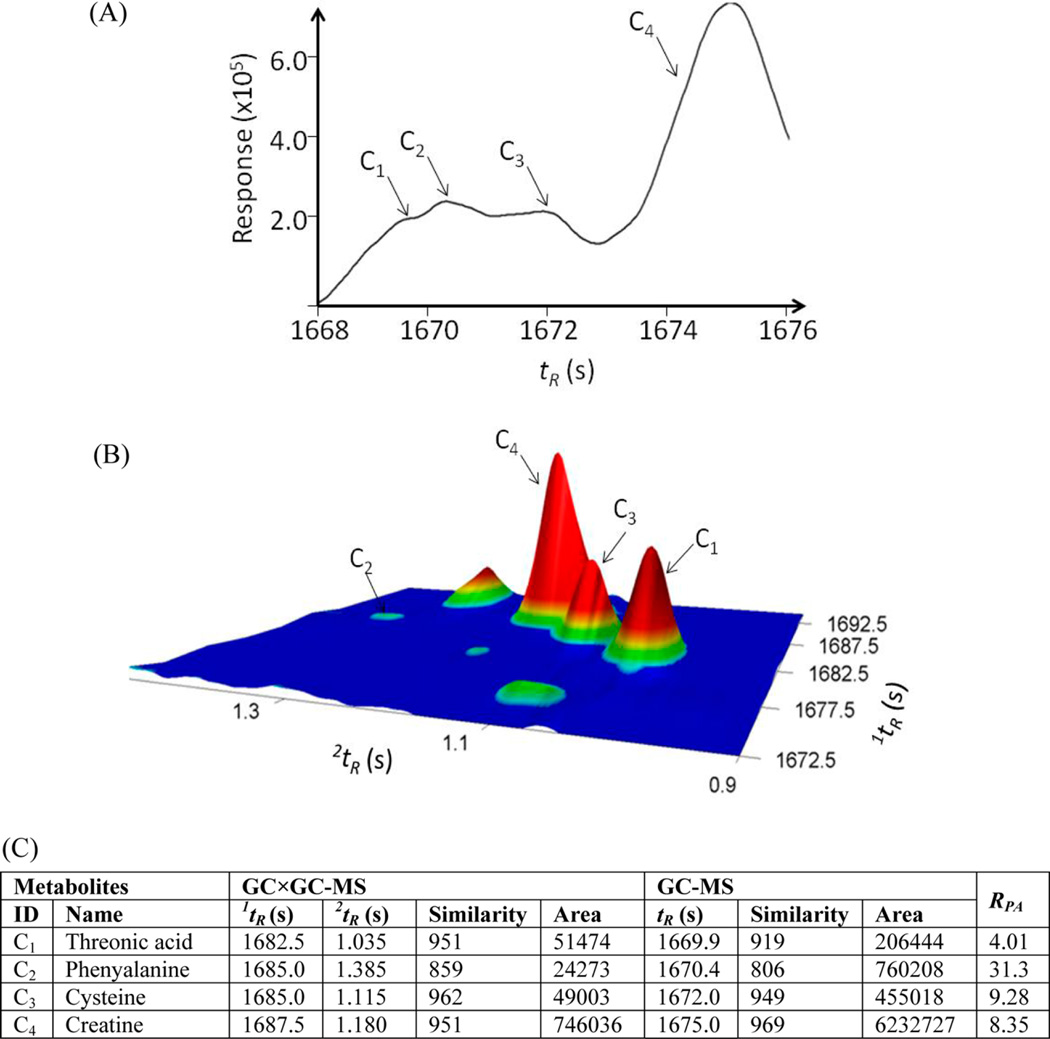
Figure 3.
Sample spectrum deconvolution in analysis of GC-MS and GC×GC-MS data. A portion of the total ion current chromatogram of a biological sample analyzed on GC-MS (A) and GC×GC-MS (B) are shown. Part C lists the information on deconvoluted metabolite peaks from the GC-MS and the GC×GC-MS data shown in A and B. RPA defined as the ratio of peak area of a metabolite deconvoluted from the GC-MS data divided by that deconvoluted from the GC×GC-MS data.

