Figure 1.

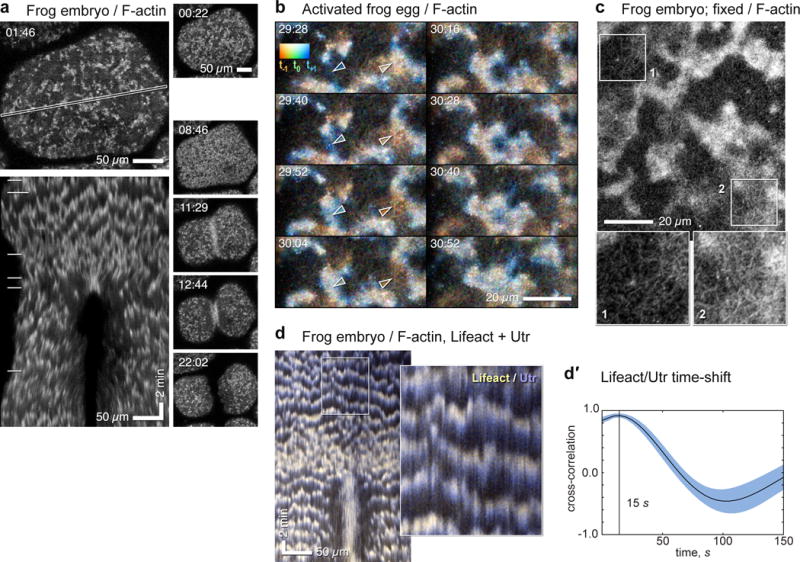
Cortical waves of actin assembly and disassembly in activated frog eggs and embryos. (a) Surface view of frog blastomere expressing GFP-UtrCH to label F-actin. Top left: single frame; cortical F-actin consists of irregularly sized patches throughout cortex, which, as illustrated in the kymograph made from the outlined region (bottom left) travel continually across the surface (see Supplementary Video 1). In the kymograph, F-actin waves create slanted bands with semi-regular spacing. Right: sequential frames from the same sequence throughout cytokinesis; horizontal lines in kymograph indicate times corresponding to individual en face frames shown to the right. For this and all other figures, time in min:sec. (b) High magnification time-lapse sequence of activated frog egg expressing GFP-UtrCH (see Supplementary Video 2), color coded by rendering the current frame malachite, next frame blue, last frame copper: thus new F-actin is bluish, old F-actin reddish. On left, leading edge of F-actin wave progresses downward while trailing edge disappears. On lower right, old F-actin wave dissipates. Cables of F-actin are apparent within and between receding waves. Swatch shows colors resulting from blending RGB channels with low (bottom of swatch) to high (top of swatch) overlap. Arrowheads indicate rising (left) and falling (right) wave fronts (arrow color sampled locally). (c) Fixed frog embryo stained with fluorescent phalloidin to reveal endogenous cortical F-actin; closely resembles Fig. 1b. 2× enlarged insets (bottom) correspond to areas indicated by boxes. Inset 1 shows region between waves, inset 2 shows wave. Cables are present in both but are brighter and denser in wave. (d) Kymograph from time-series of frog embryo co-expressing GFP-Lifeact (yellow) and mCherry-UtrCH (blue) to label newer and older actin, respectively (see Supplementary Video 3, Supplementary Figure 1d); inset is a 3× blowup. Leading edges of each wave (top of bands in kymograph) have proportionately more Lifeact and trailing edges (lower part of bands) more UtrCH, even though both probes qualitatively label the same features (Sup. Fig. 1d). (d′) Cross-correlational analysis showing 15s delay between recruitment of Lifeact and UtrCH. Images are representative of at least 40 (a), at least 30 (b), and 3 (c, d) independent experiments, respectively.
