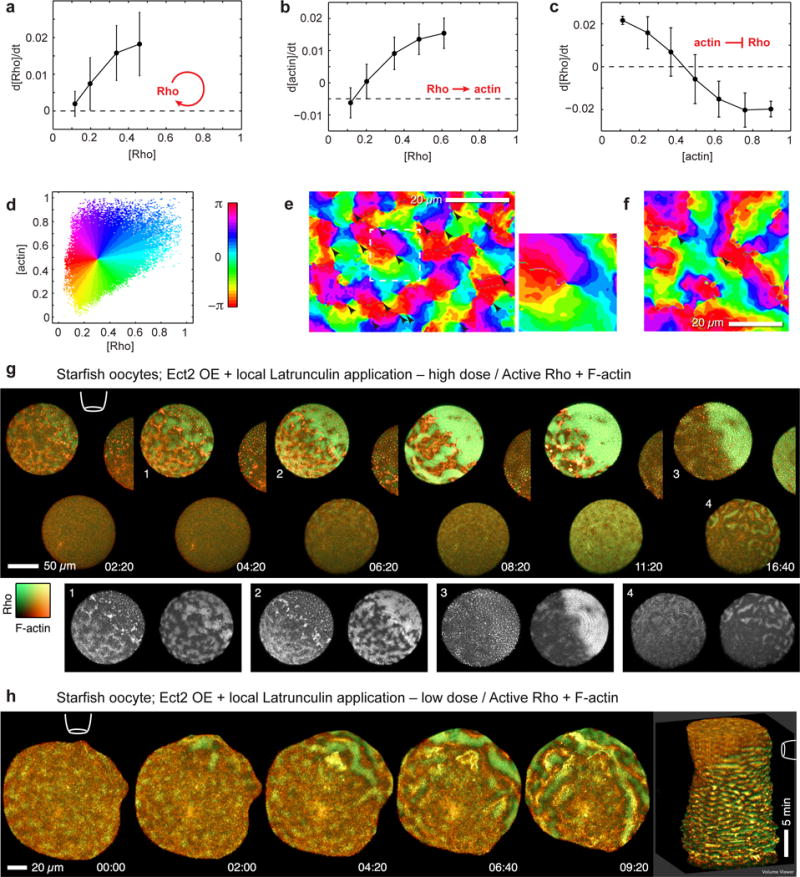
Figure 5.

Analysis of Rho and F-actin dynamics reveals cortical excitability and spiral turbulence. (a) Rho activation rate (mean ± SD) increases with Rho activity signal indicating that Rho activates itself in a positive feedback loop. Correlation assessed from pixels with low F-actin signal (see Supplementary Figures 4a). (b) F-actin accumulation rate is positively correlated with Rho activity (assessed from pixels with low F-actin signal). (c) Rho activation rate is inversely correlated with F-actin signal, to the point of switching to inactivation at high F-actin density (assessed from pixels with high Rho activity signal). Results are mean ± SD; n=900 cycles. (d) Each cortical locus (image pixel) can be mapped by its particular values of Rho activity and F-actin density to a single phase value, an angle between 0 and 2π, shown in rainbow colors: Cortical loci at the front of waves appear green, loci at Rho wave crests as cyan, at F-actin wave crests as dark blue-magenta, and loci at the back of the wave are red and orange. (e) Phase reconstruction for starfish oocyte overexpressing Ect2 (Supplementary Video 13). Points where all rainbow colors (phase values) merge indicate spiral cores (arrowheads). Inset: magnification of spiral wave core neighborhood outlined by dashed line. (f) Phase reconstruction for activated frog egg overexpressing Ect2. (g) Meiotic Ect2-overexpressing starfish zygotes containing GFP-rGBD (Rho activity; malachite) and mCherry-Utr (F-actin; copper), time-lapse sequence after application of high concentration of LatB (10 uM) from agarose-filled pipette (position indicated by cartoon); treatment causes rapid cortical F-actin collapse and corresponding burst of Rho activation (see Supplementary Video 14). Insets: single channel images of cells/stages indicated by numerals: 1) initial response, 2) wave regime on far side, collapse on near side, 3) total collapse, 4) wave regime on near side of distant oocyte (h) Similar to (g), but low-dose (1 uM) LatB induces shift from typical Ect2-enhanced wave regime to higher-amplitude, longer-period wave regime, in which large scale Rho waves propagate away from site of local F-actin disassembly (see Supplementary Video 15); rightmost image is kymocube rendered using ImageJ. Images are representative of 5 independent experiments.
