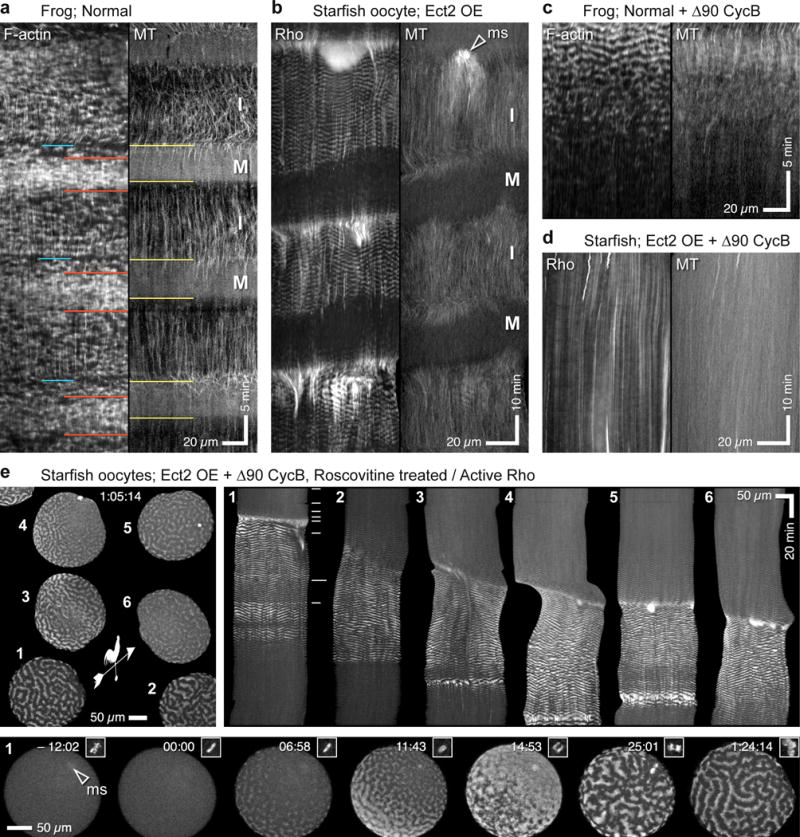
Figure 6.

Cdk1 gates excitability. (a) Kymograph from normal frog embryo showing waves of cortical F-actin (left) and cortical microtubules (right). I=Interphase; M=M-phase; Yellow lines on right indicate M-phase onset, as revealed by loss of cortical microtubules. Actin waves persist throughout M-phase but wave density varies: at M-phase onset (blue line on left), waves are spaced farther apart; this is followed by period of same length as M-phase but slightly delayed in which F-actin waves are brighter (red lines). (b) Kymograph from double-labeled starfish oocyte overexpressing Ect2 showing waves of cortical Rho activity (left) and cortical microtubules (right). Rho waves cease in each M-phase and reappear in each interphase. ms = meiotic spindle. (c) Kymograph of frog blastomere expressing Δ90 cyclin B showing cortical F-actin (left) and cortical microtubules (right). As time of high Cdk1 activity lengthens (revealed by loss of cortical microtubules) cortical F-actin waves progressively disappear. (d) Kymograph of Ect2-overexpressing starfish oocyte expressing Δ90 cyclin B as well, showing cortical Rho activity (left) and cortical microtubules (right). Rho waves fail to appear as cell remains arrested with high Cdk1 activity. (e) Top left: Rho activity in starfish oocytes overexpressing Ect2 and expressing Δ90 Cyclin B, 65 min after treatment with 40 μM roscovitine to inhibit Cdk1 (see Supplementary Video 16). Weather vane indicates direction of roscovitine flow. Roscovitine-containing seawater perfused around tight-packed oocytes from Southeast to Northwest at time 00:00; cells 1 and 2 are at cluster edge, cells 5 and 6 are in cluster center; hence, weathervane indicates presumed gradient of drug exposure. All oocytes show robust Rho waves at this time point. Top Right: kymographs of oocytes (identified by numerals) showing development of cortical Rho activity waves following Roscovitine treatment. Note that onset of waving follows expected rate of Cdk1 inhibition based on access to drug in perfused media. Bottom: successive frames showing oocyte 1 alone; inset shows chromosomes, arrowhead indicates position of meiotic spindle. Rho waves are well developed at least five minutes before anaphase begins. Images are representative of 4(a), 3(b), 5(c) and 6(d) independent experiments, respectively.
