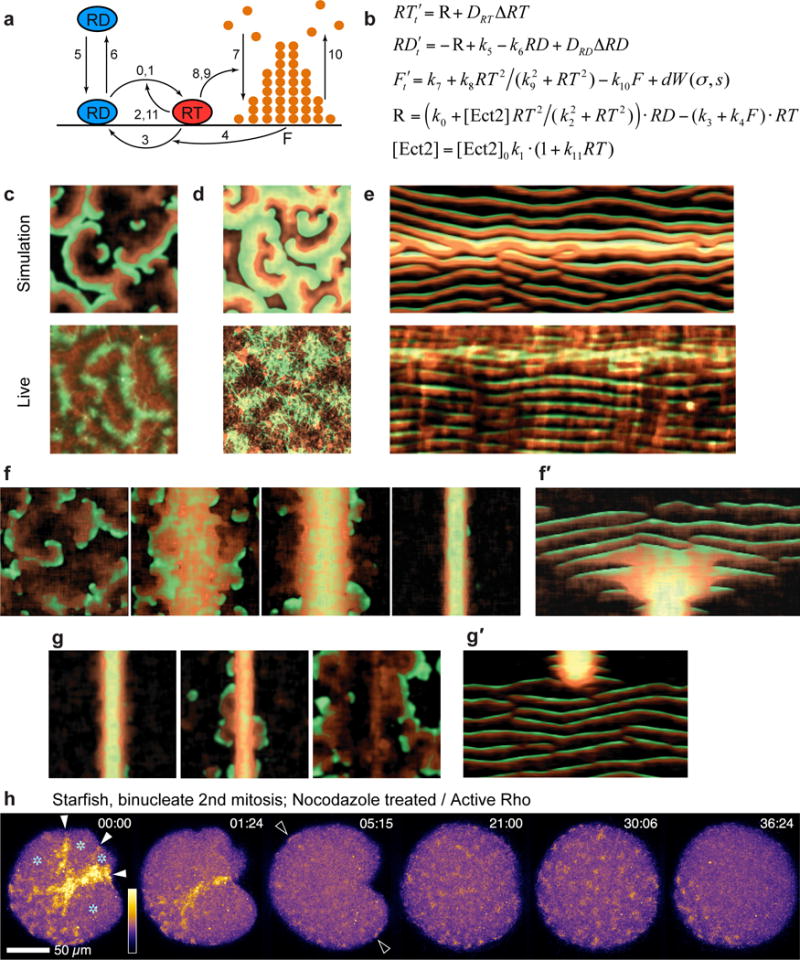
Figure 8.

Model of excitable dynamics predicts that Ect2 spatio-temporal distribution determines the pattern of Rho-actin cortical activity. (a) Schematic diagram of the molecular processes described by the model (see Methods). Numbers on the arrows correspond to numbers of rate constants in b. (b) Model equations (see Supplementary Figure 6a and Methods). (c) Top: Simulation of wave turbulence with Ect2 level representing interphase wave pattern in starfish oocytes with extra Ect2 (see Supplementary Video 19), active Rho (malachite) and F-actin (copper). Bottom: image of cortical Rho (malachite) and F-actin (copper) from Ect2-overexpressing starfish oocyte for comparison. (d) Top: Model dynamics at the peak of global Ect2 activity – representing polar body emission phase – demonstrates a characteristic wave pattern with broad crests, substantial overlap of Rho and F-actin maxima and narrow refractory zones between wave crests (see also Supplementary Figures. 6b,c and Methods). Bottom: image of cortical Rho (malachite) and F-actin (copper) from Ect2-overexpressing oocyte at time of polar body emission for comparison. (e) Top: Model kymograph of Rho activity and F-actin prior to, during, and after polar body emission (see Supplementary Video 19). Bottom: experimental kymograph for comparison. (f) Emergence of furrow through condensation of waves in a simulation representing mitotic starfish cells with progressive focusing of Ect2 at the cell equator (see Supplementary Video 20). (f′) Kymograph along a line perpendicular to the furrow for model behavior in f. (g) Simulation of rapid microtubule depolymerization after furrow zone formation: furrow signal dissipates and spatially-homogeneous waves return. (g′) Kymograph of simulation shown in f. (h) Behavior of cortical Rho waves following experimental microtubule depolymerization by nocodazole in binucleate starfish zygote at the onset of cytokinesis. Cytokinetic Rho zones dissipate quickly and waves repopulate the entire cortex. Asterisks indicate spindle pole positions; solid arrowheads indicate Rho zones in nascent furrows; hollow arrowheads point out instances of cortical Rho waves in once-bare territory (see Supplementary Video 21). Images in h are representative of 3 independent experiments.
