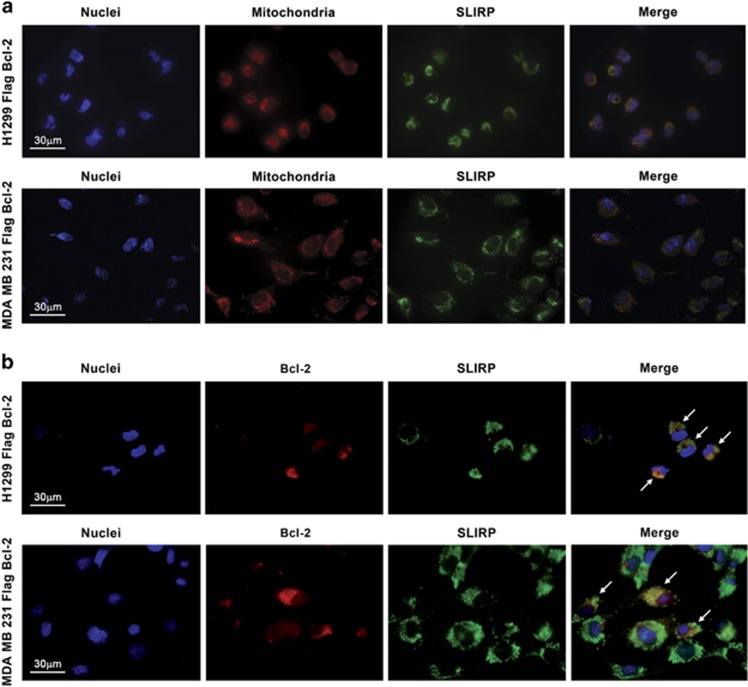
Figure 3.
Immunofluorescence analysis. (a) Immunostaining analysis showing the co-localization of antibody-stained SLIRP (green) with Mitotracker-labeled mitochondria (red) in H1299 and MDA-MB-231 cell lines overexpressing bcl-2. (b) Immunostaining analysis showing partial co-localization between endogenous SLIRP (green) and bcl-2 (red) in H1299 and MDA-MB-231 cell lines overexpressing bcl-2; arrows indicate bcl-2/SLIRP co-localization. a, b: Representative images from one experiment are shown. Detailed images of single cell acquired with × 100 objective are reported in Supplementary Information (Supplementary Figure 1)

