Figure 5.
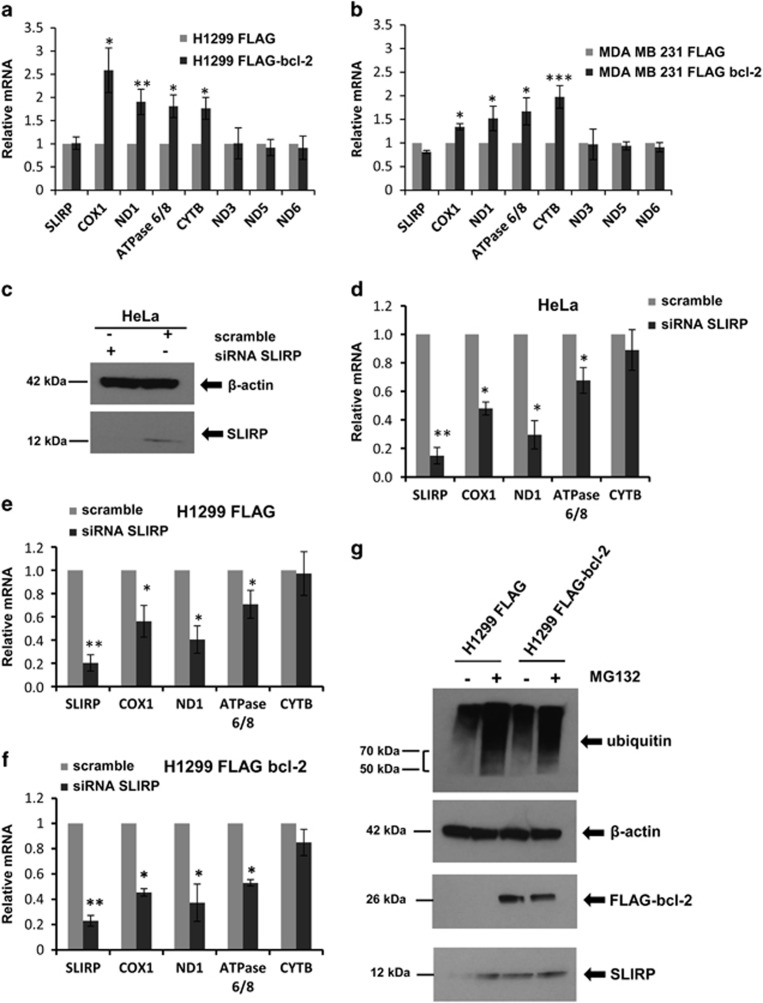
Analysis of mitochondrial mRNA levels. Mitochondrial mRNA levels determined by qRT-PCR in H1299 (a) and MDA-MB 231 (b) control and bcl-2-overexpressing cell lines. Values are expressed as means of ratio±S.E.M., where ‘ratio' was calculated considering bcl-2-overexpressing cells versus control cells. P-values are calculated between control and bcl-2-overexpressing cells. (c) Western blot analysis of SLIRP downregulation in HeLa cells. SLIRP silencing was achieved by using a targeted pool of siRNA (siRNA SLIRP). A pool of siRNA against scramble target sequence was used as control (scramble). (d–f) Mitochondrial mRNA levels determined by qRT-PCR in (d) HeLa, (e) H1299 control (H1299 FLAG) and (f) H1299 bcl-2-overexpressing (H1299 FLAG bcl-2) cells transfected with siRNA scramble or siRNA SLIRP. Values are expressed as means of ratio±S.E.M., where ‘ratio' was calculated considering siRNA SLIRP versus siRNA scramble cells. (g) Western blot analysis of FLAG bcl-2, SLIRP and poly-ubiquitinated proteins from H1299 control and bcl-2-overexpressing cells in the presence or absence of 10 μM MG132 for 6 h. (c and g) β-Actin was used as control loading. (a, b, d–f) *P<0.05; **P<0.01; ***P<0.001

