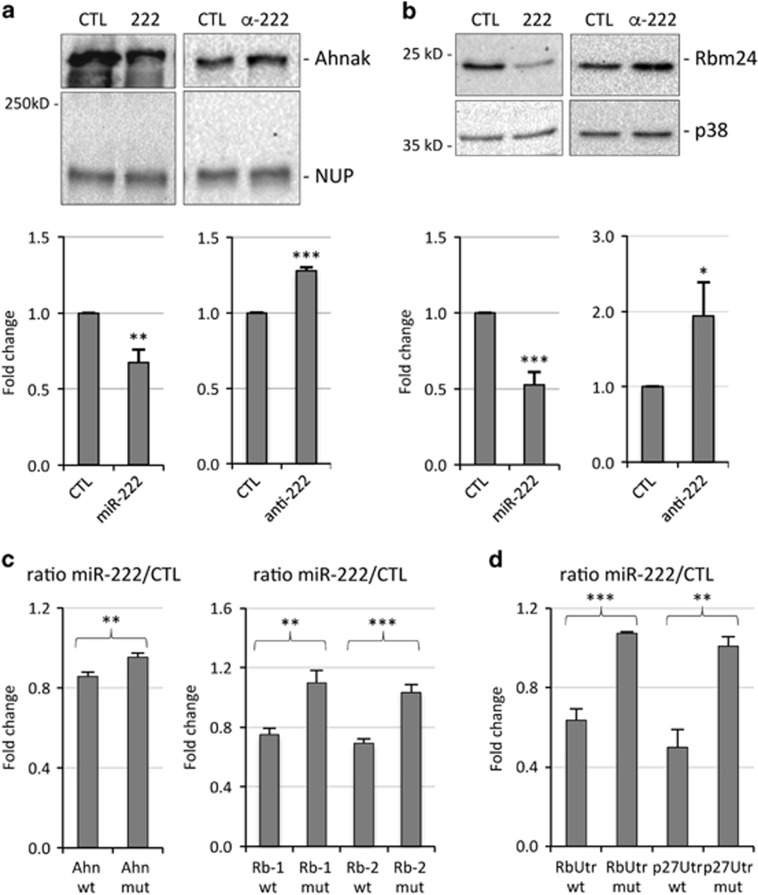
Figure 2.
Validation of Ahnak and Rbm24 as direct targets of miR-222. (a, b) MSC myocytes, kept in DM for 30 h, were transfected with miR-222 mimic (222) or antisense inhibitors (α-222) and relative controls siGFP or anti GFP (CTL). After 48 h, cells were lysed for protein analysis. Western blot analysis of Ahnak (a) and Rbm24 (b) expression levels; Nucleoporin (NUP) and p38 proteins were used as loading controls. The histograms in (a) and (b) (lower panels) show the quantitation of expression levels of Ahnak and Rbm24, normalized to Nucleoporin and p38, in myocytes transfected with miR-222 mimic or inhibitor versus myocytes transfected with control RNAs, referred as 1. The error bars represent the average±S.E. (n=3–6; *P<0.05; **P<0.01; ***P<0.001). (c) 293FT cells were transfected with empty firefly luciferase reporter vector (pMIR-REPORT) or derived constructs containing either an intact miR-222-binding site (wt), or a mutated miR-222-binding site (mut) in Ahnak and Rbm24 target regions. For Rbm24 both miR-222 target sites were analyzed (Rb-1, Rb-2). (d) 293FT cells were transfected with empty firefly luciferase reporter vector (pGL3) or derived constructs containing an intact portion of the 3'UTR of Rbm24 (RbUtr wt) or p27 ( p27Utr wt) or mutated 3'UTRs (mut). (c, d) Each plasmid was co-transfected with a plasmid encoding renilla luciferase along with miR-222 mimic or negative control (CTL). Activities of each pMIR-REPORT and pGL3 construct were normalized first to renilla luciferase and then to empty vector activities. The ratio of luciferase activity in cells transfected with miR-222 mimic versus cells transfected with control RNA is expressed as fold change. The error bars represent the average±S.E. (n=3–5; **P<0.01; ***P<0.001)

