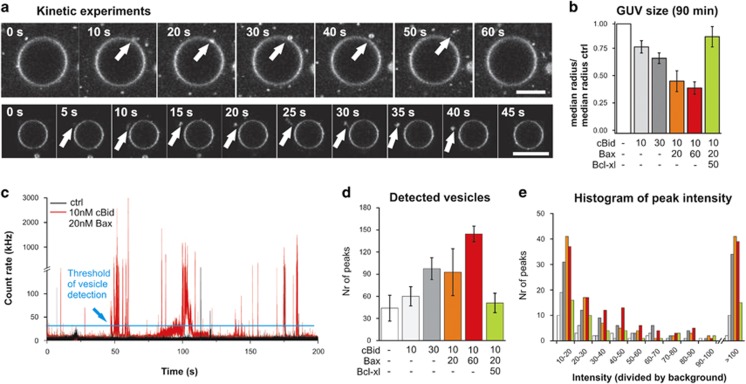
Figure 3.
GUV budding upon incubation with Bcl-2 proteins. (a) Snapshots of vesicle budding from kinetic experiments. GUV mimicking the MOM composition labeled with DiI incubated with 10 nM cBid and 20 nM Bax. Scale bar: 20 μm. (b) Changes in GUV size upon 90 min incubation with the indicated proteins at 22 °C. (c) Exemplary fluorescence intensity trace of a control sample and a sample incubated with 10 nM cBid and 20 nM Bax. The background count rate is <3 kHz. Fluorescent bursts >10 times brighter as the background count rate are considered as diffusing vesicles. (d) Number of peaks detected during 600 s (with count rates >29 kHz) after 90 min incubation with the indicated proteins at 22 °C. Error bar present the S.D. (N=3). (e) Histogram of the different peak intensities describes in (d). The color code is the same as in (d)

