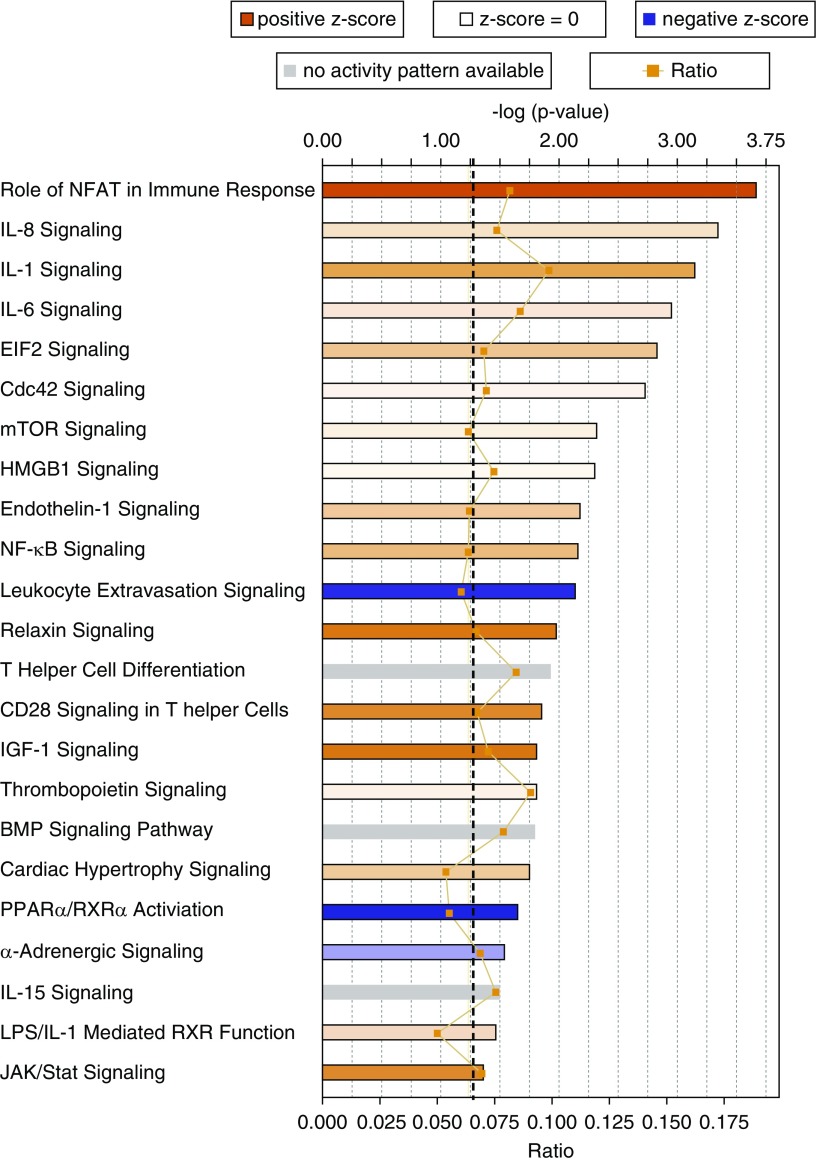
Figure 9.
Canonical pathways significantly overrepresented in the gene expression data. The most statistically significant canonical pathways in the differential expression data (comparing mutant bone marrow cells with control bone marrow cells) are shown. Orange–red is indicative of pathway activation; blue is indicative of pathway repression. Color strength shows the degree of activation and repression. The orange line shows the ratio of genes found in each pathway over the total number of genes known to be in that pathway. The dashed black line represents the threshold line and corresponds to a P value of 0.05. The significance of the association between the dataset and the pathway was measured in two ways: (1) a ratio of the number of molecules from the dataset that map to the pathway divided by the total number of molecules that map to the canonical pathways (indicated by the orange line and boxes), and (2) Fisher’s exact test was used to calculate a P value determining the probability that the association between the genes in the observed values and the canonical pathway is explained by chance alone. BMP = bone morphogenetic protein; EIF2 = eukaryotic initiation factor 2; HMGB1 = high-mobility group box 1; IGF = insulin-like growth factor; JAK = Janus kinase; mTOR = mammalian target of rapamycin; NFAT = nuclear factor of activated T cells; NF-κB = nuclear factor-κB; PPARα/RXRα = peroxisome proliferator–activated receptor-α/retinoid X receptor-α.

