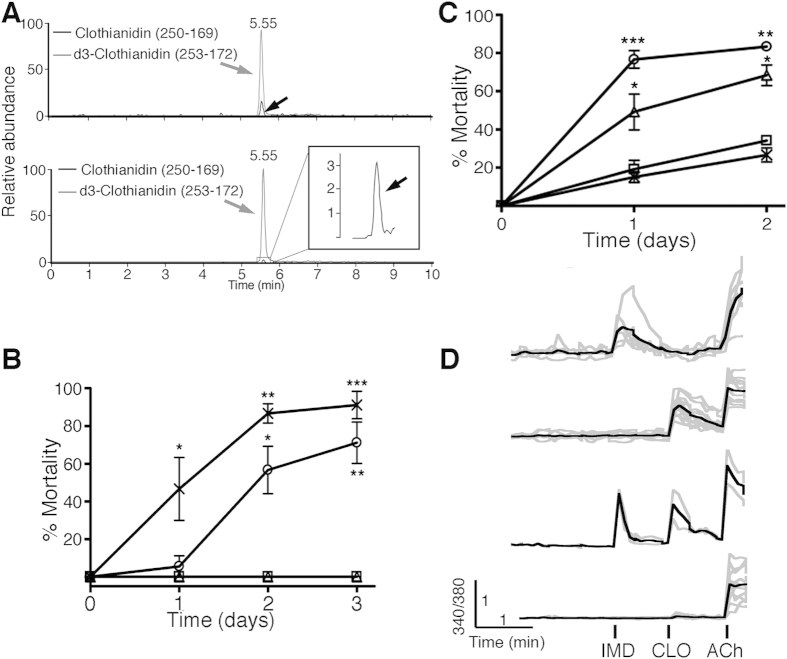
Figure 1. Differential neonicotinoid function on individual bees and neurons.
(A) Representative LC-MS/MS chromatograms to indicate CLO signals detected in isolated brains derived from bees fed CLO (10 nM, upper panel) or THX (10 nM, lower panel) for 3 days. The signal from CLO is indicated with a black arrow and the spiked in d3-CLO (internal standard) is indicated with a grey arrow. CLO is eluted at around 5.55 min. (B) Naïve (not previously exposed to neonicotinoids) bumblebee microcolonies (30 bees) were fed untreated syrup (□) or syrup laced with 100 ppb w/v IMD (390 nM, Δ), THX (342 nM, O) or CLO (400 nM, X) for 3 days and mortality monitored on each day. The data from 3 experiments are pooled and expressed as % mortality. (C) Bumblebee micro-colonies (40 bees) fed untreated syrup (X) or syrup laced with field-relevant levels of neonicotinoid (10 nM): IMD (□), CLO (Δ) or THX (Ο). After 7 days (no bee deaths observed during this period), the sugar syrup was replaced with 50 ppb CLO for 1–2 days and mortality monitored on days 1 and 2. The data from 3 independent experiments are pooled and expressed as % mortality. Significance (B,C) is versus UT using two-way Anova with Bonferroni’s post-test. P-values are *≤0.05, **≤0.01 and ***≤0.001 respectively). Error bars are S.E.M (n = 3). (D) Calcium influx (ratiometric (340/390 nm) signal generate from a Fura-2AM probe) from individual bumblebee primary neurons in culture in response to the sequential exposure to IMD (10 nM), CLO (10 nM) and finally ACh (1 mM). The grey traces represent individual Ca2+ responses from single cells and the black trace represents the average response.

