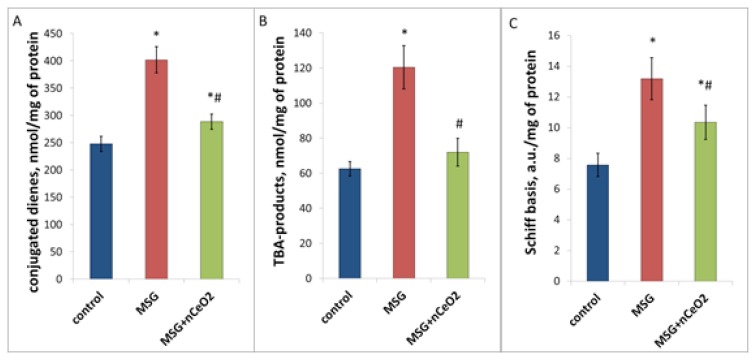
Figure 3.
Lipid peroxidation in the rat liver under conditions of MSG-obesity and nCeO2 (1 mg/kg) treatment. A, B, C – content of conjugated dienes, TBA-products and Schiff basis in the liver, correspondingly. * – p<0.05 compared to control rats without obesity, # – p<0.05 compared to rats with MSG-obesity. Data are presented as the M ± SEM. One-way ANOVA with post hoc Tukeys test for multiple comparisons were performed for data analysis.

