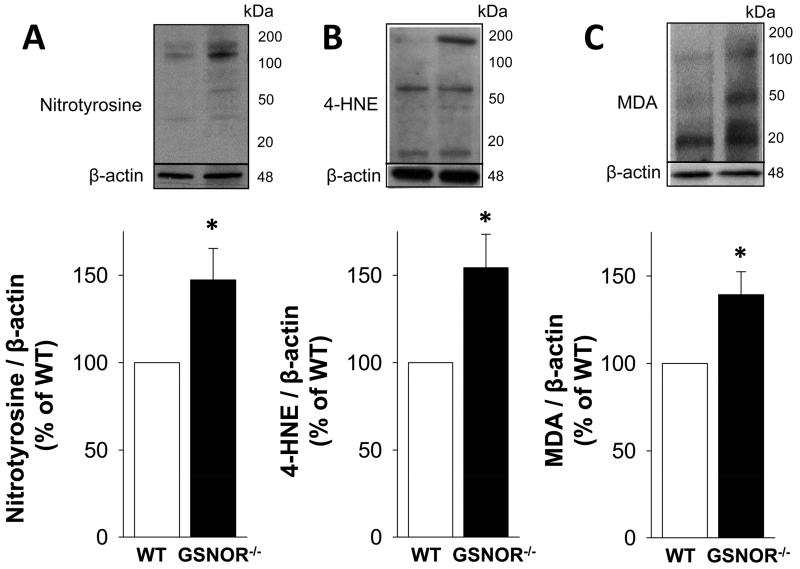
Figure 6.
Protein expressions of oxidative stress markers nitrotyrosine (A), 4-HNE (B), and MDA (C), are increased in GSNOR−/− compared to WT mouse penis. The upper panels display representative Western immunoblots. The lower panels display quantitative analyses of the proteins in the same groups. The analysis applies a densitometric composite of all proteins in each lane. Each bar represents the mean ± SEM. *p < 0.05 vs WT. n = 7.

