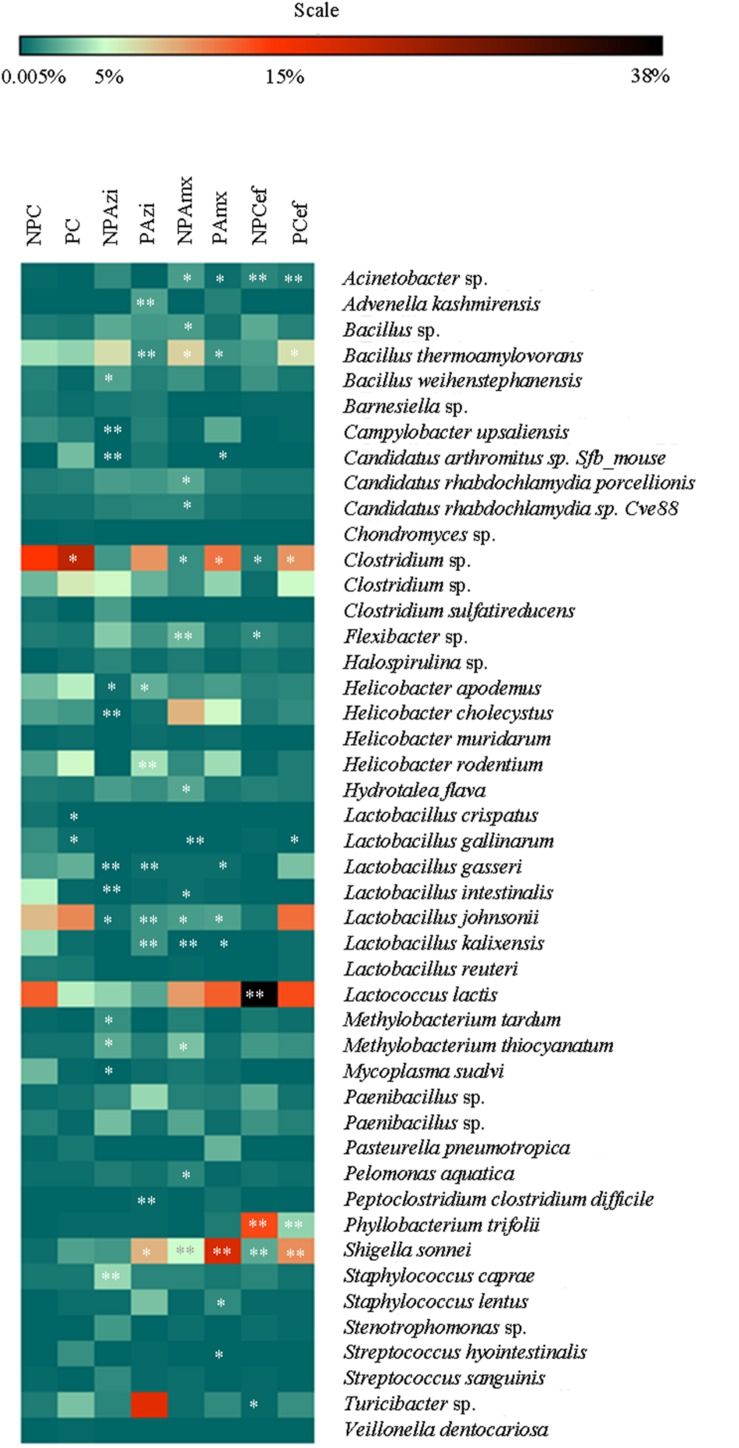
FIGURE 5.
Heat map of the dominant and significantly different species in the gut microbiota of control versus pregnant and antibiotic-treated rat groups. The stearic represents significant change in respective group. ∗Indicates significant at p < 0.05. ∗∗Indicates highly significant at p ≤ 0.01. Abbreviations are as described for Figure 1.

