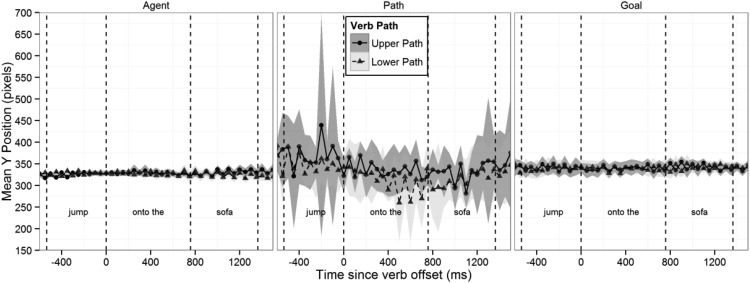
Figure 3.
Mean y-coordinate of fixations over time (zeroed at mean verb offset) in Experiment 1, broken down by region (Agent, Path, and Goal) and verb condition (Upper Path vs. Lower Path). Error ribbons show corrected within-participants 95% confidence intervals (cf. Morey, 2008).

