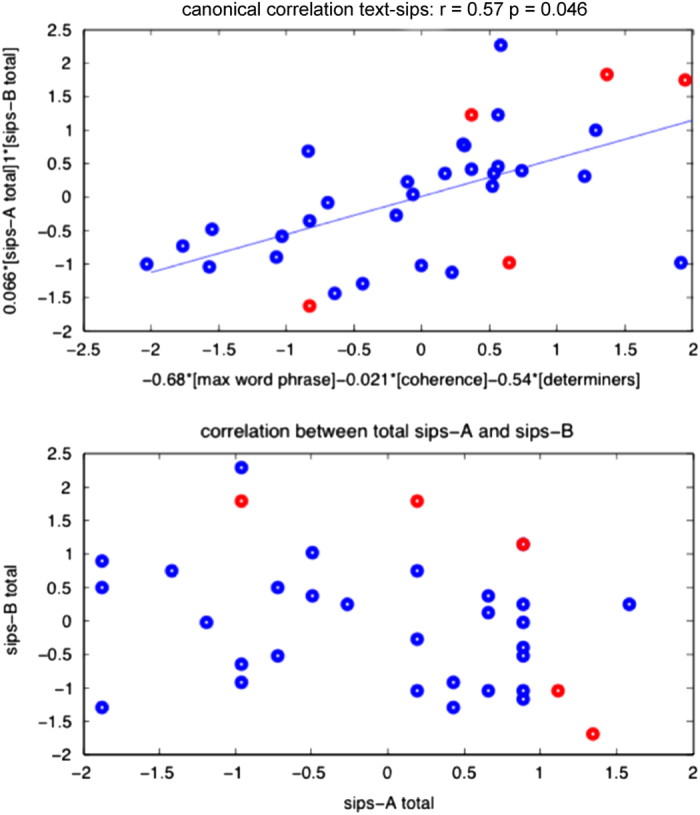
Figure 5.

Correlations of text features and clinical ratings (top panel) and between positive (sips-A) and negative (sips-B) symptoms (bottom panel). Upper panel: canonical correlation between the text features, and the Structured Interview for Prodromal Syndromes (SIPS) features. Lower panel: scatter-plot of Atotal and Btotal shows no association between subthreshold psychotic symptoms and negative symptoms. In both panels, clinical high risk− (CHR−) and CHR+ are labeled with blue and red dots, respectively. For the analysis, all features were centered and normalized.
