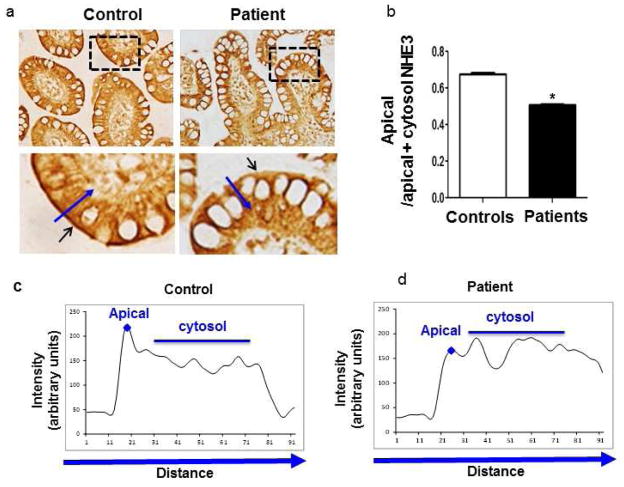
Figure 2. Decreased NHE3 expression in ileal apical membranes from rapamycin-treated patients with acute diarrhea.
(a) Representative images of immunostaining of NHE3 in the terminal ileum from a control and one rapamycin-treated patient. The dashed areas were magnified as shown in the bottom panels. The small arrows point to the apical membrane with staining of NHE3. A long line with an arrowhead was drawn over the apical membrane and cytoplasmic area for quantification. (b & c) The intensity of NHE3 staining along the line with an arrowhead (a). The peak labeled with a diamond symbol represents NHE3 staining at the apical membrane. The average intensity of all data points underneath the line serves as the cytosolic NHE3 staining. (d) The bar graph presents the average of apical/apical+cytosol NHE3 in ileum samples from renal transplant patients compared to controls (*p<0.05 t-test, n=5 areas/slide, N=11 patients and 10 controls).

