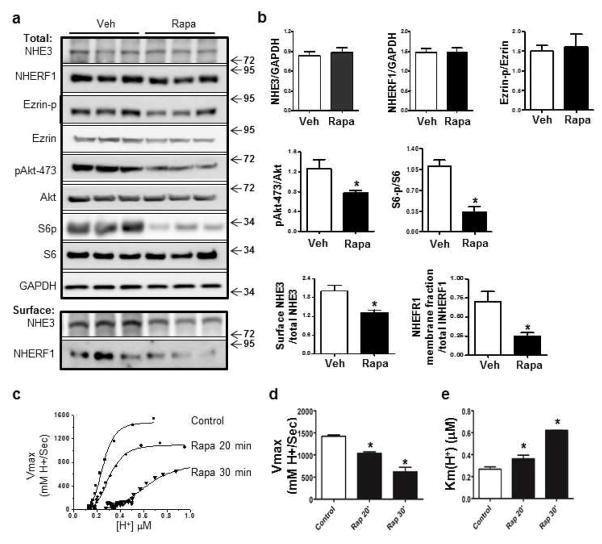
Figure 5. An acute effect of high-dose rapamycin on NHE3 expression.
(a–b) Western blot analysis (a) and quantification (b) of NHE3, NHERF1, total and p-Ezrin, total and p-S6, total Akt and p-Akt at Ser473. (a) Surface biotinylation assay and quantification (b) of NHE3 and NHERF1 in the membrane fraction of intestinal tissue from vehicle- and rapamycin-treated mice (*p<0.05, t-test, N=3). (c) Representative traces showing the effect of rapamycin on Na+/H+ activity in PS120 cells stably expressing NHE3 and NHERF2. Bar graph showing Vmax (d) and K(H+)i (μM) (e) in vehicle- and rapamycin-treated groups (*P<0.05, One way ANOVA with Dunnett’s post hoc test, N=3).

