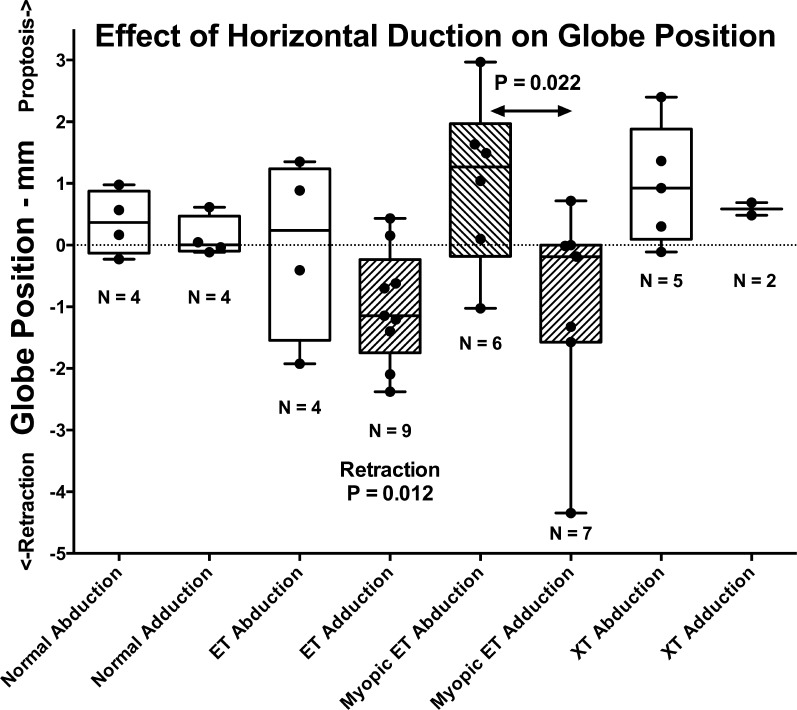
Figure 8.
Box and whiskers plot showing effect of horizontal duction on anteroposterior position of the equatorial globe centroid as measured in axial MRI. Retraction in nonmyopic subjects with esotropia (ET) was significant by 1-sample t-testing against zero. Anteroposterior centroid position was significantly more posterior in adduction than abduction in axially myopic subjects with ET (P = 0.022 by Kruskal-Wallis test). Rectangles represent interquartile range with median indicated by horizontal bar. Whiskers represent maxima and minima. Individual observations are indicated by filled circles.

