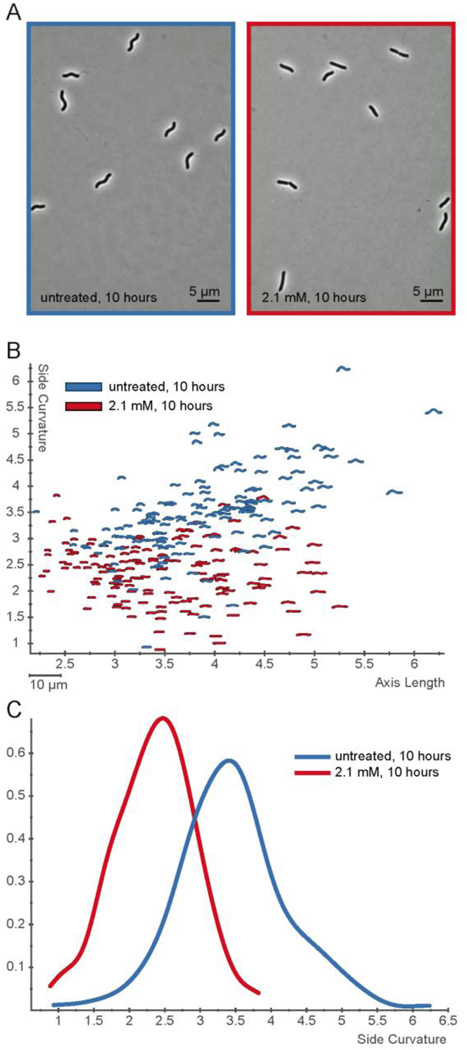
Figure 5.
Inhibitor 1 alters H. pylori cell shape. A) Phase contrast images of H. pylori (KBH19) treated for 10 hours without (blue, left) or with 2.1 mM inhibitor 1 (red, right). B) Scatterplot of 100–200 cell contours per condition from phase contrast images of cells grown for 10 hours with 2.1 mM inhibitor 1 (red) or without (blue). Axis length is plotted on the x-axis and side curvature is plotted on the y-axis. C) Smooth histogram of population side curvature values for cells treated for 10 hours without (blue) and with 2.1 mM inhibitor 1 (red). Treated cells have significantly lower side curvatures than u––––ntreated cells (p<0.00001).

