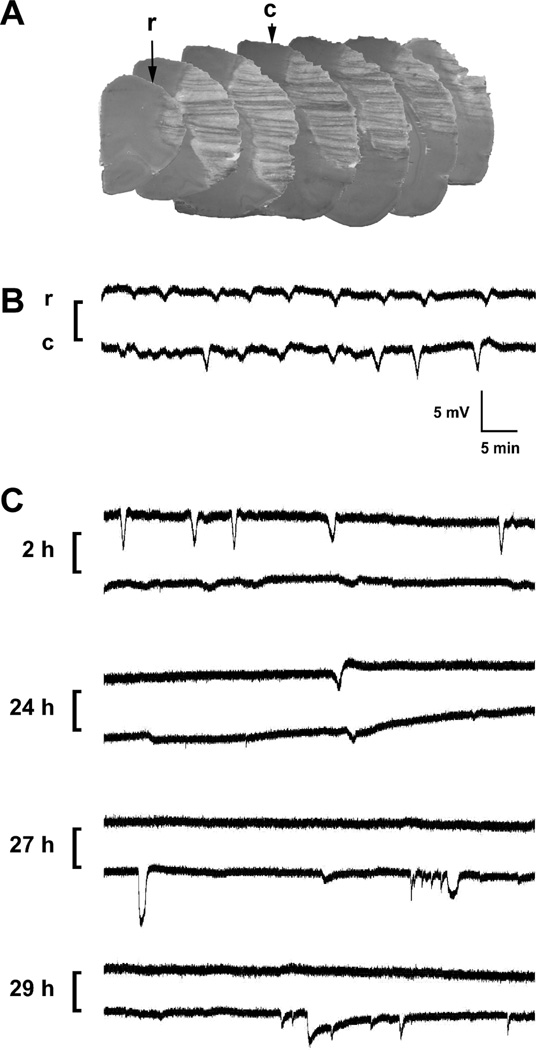
Fig. 2.
Infarct distribution, electrode placement and representative recordings. A) Electrode positions and infarct distribution. Rostral (r) and caudal (c) sites were chosen to overlie positions outside the expected cortical infarct distribution characteristic of the SHR model, shown at 2 mm intervals through the extent of MCA territory in a series of hematoxylin-eosin stained frozen sections from a rat subjected to permanent occlusion. B) Typical paired events. Traces illustrate a series of depolarizations propagating past the two electrode positions during the initial hours after permanent occlusion. C) Atypical dissociated depolarizations. Paired traces are illustrated as in panel B. Prominent PIDs detected at the rostral electrode during the initial hours after transient occlusion were poorly detected at a caudal position overlying the eventual infarct margin. Such events recorded only at the rostral electrode were included in the quantitative assessment. In contrast, depolarizations of variable magnitude and duration restricted to the caudal peri-infarct site at later intervals were not counted in the tally of propagated events.

