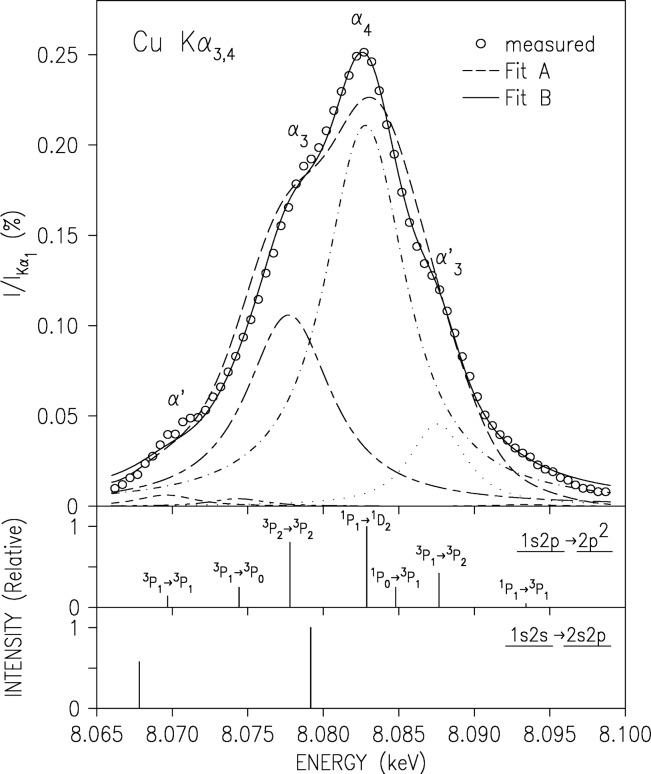
Fig. 13.
The measured CuKα3,4 satellite spectrum (points), with its fit by the ab-initio RMCDF calculations. The fits are based on the 1s2p → 2p2 transitions shown as a “stick diagram” in the lower panels. Note the good agreement. The lines in the second panel are marked by the LS notation of their major constituents. The calculated 1s2s → 2s2p transitions are shown in the third panel. The fits reveal that these transitions do not contribute to the lineshape to any detectable level.

