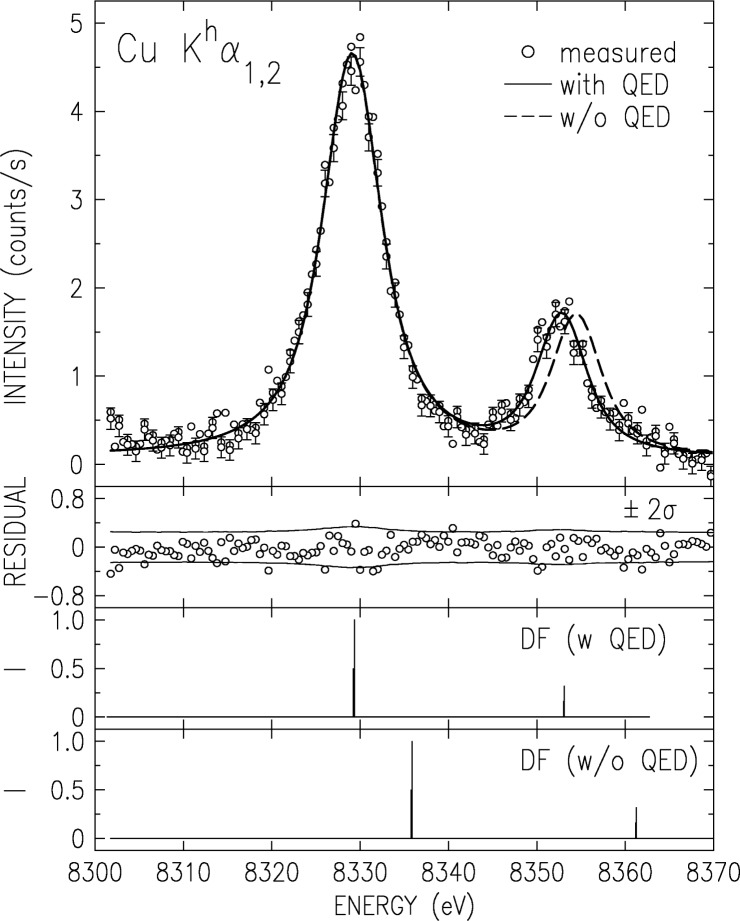
Fig. 15.
The measured CuKhα1,2 hypersatellite spectrum (points) with its fit (solid line) by the RMCDF calculated “stick diagram” in the third panel. The fit residuals are shown in the second panel. Note the good fit when QED corrections are included in the calculations. The spectrum calculated without these corrections (fourth panel) is upshifted relative to the measured spectrum. It can not be fitted to the measured spectrum even when downshifted, due to its too large line splitting (dashed line). This demonstrates the large contribution of QED effects to the hypersatellite spectra.

