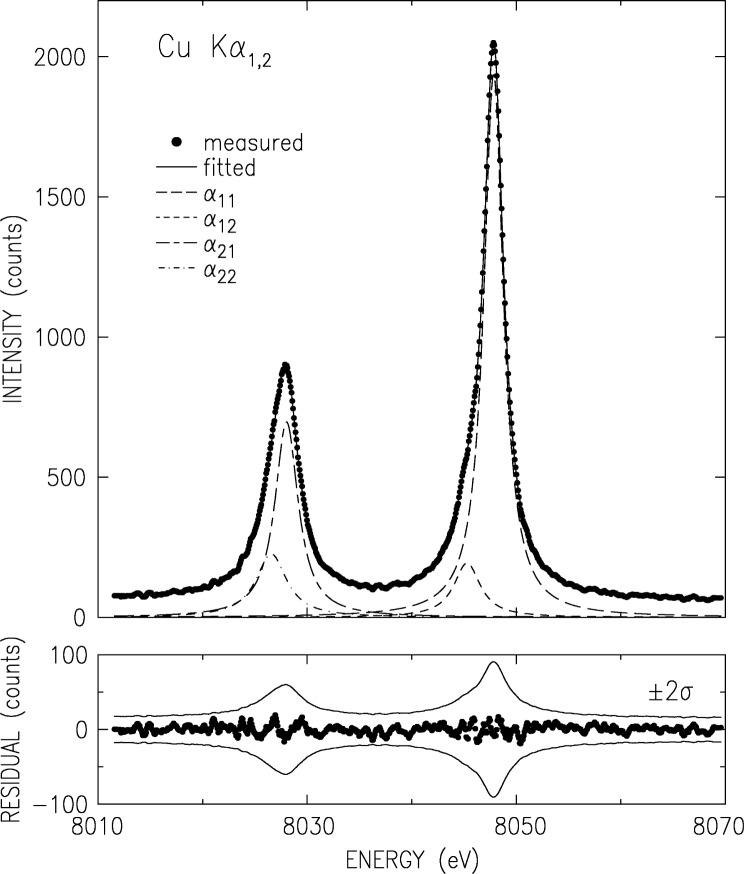
Fig. 2.
Double-crystal spectrometer measured and smoothed CuKα3,4 spectrum (points) and fitted Lorentzians. The fit parameters are given in Table 2. The lower panel shows the fit residuals. The thin lines denote the ±2σ values of the data, where σ is the standard deviation.

