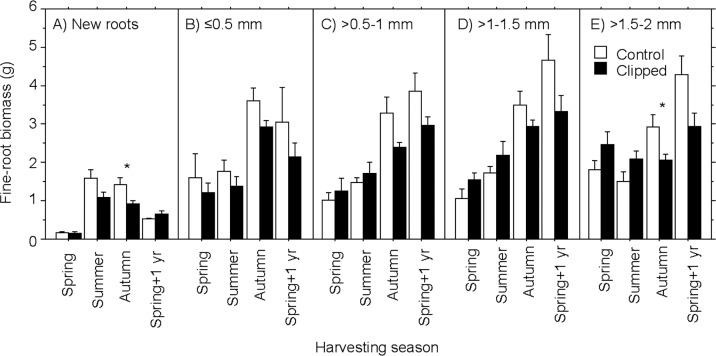
Fig 1.
Mean biomass (g, ±SE; n = 5–13, see S1 Table) of fine-root classes of control and clipped trees: (A) new roots, (B) ≤0.5 mm, (C) >0.5–1.0 mm, (D) >1.0–1.5 mm, (E) >1.5–2.0 mm. Significant differences between control and clipped trees are given with * (P<0.05).

