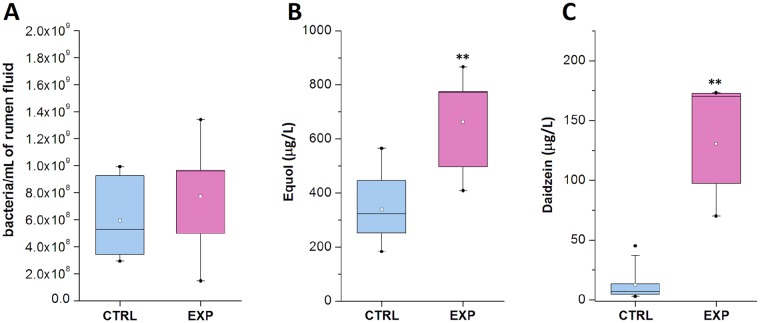
Fig 1. Characterization of rumen fluid of experimental (EXP) and control (CTRL) groups.
(A) Amount of total bacteria in 1 ml of rumen fluid from control (CTRL) and experimental (EXP) cows was quantified using qPCR according to the average 16S rRNA copy number per bacterial genome. (B, C) Daidzein and equol concentrations in rumen fluid were quantified using HPLC coupled with MS-(TOF). Control cows, n = 6; experimental cows, n = 6. Open squares indicate minima and maxima, whiskers indicate the 5th and 95th quantile, and boxes indicate the 25th and 75th quantile. A horizontal line indicates the median, and a square indicates the mean (** P < 0.05, control group versus experimental group).

