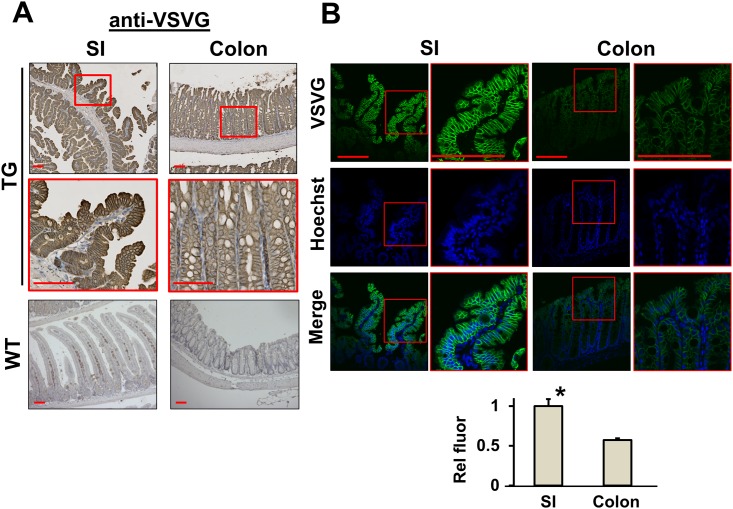
Fig 3. Expression of VSVG-LPA2 in mice.
(A) TG VSVG-LPA2 expression in small intestine (SI, left) and colon (right) of LPA2 TG (upper two panels) and WT (lower panel) mice was determined. Anti-VSVG antibody was used for immunohistochemistry. Magnification: x100. Lower panels show magnified views (x400) of the boxed area. WT was used as a negative control. Bar: 100 μm. (B) VSVG-LPA2 expression in the small intestine and colon of TG mice was assessed by immunofluorescence microscopy. Bar: 100 μm. Images were captured under identical setting to compare the relative expression levels of VSVG-LPA2 in small intestine and colon. Integrated fluorescence signal intensity was averaged over the area of epithelial cell layer. Lower graph shows the relative fluorescence signal intensity. *, p < 0.01, small intestine versus colon. n = 3 per group. Statistical analysis was performed using 2-tailed Student’s t test.

