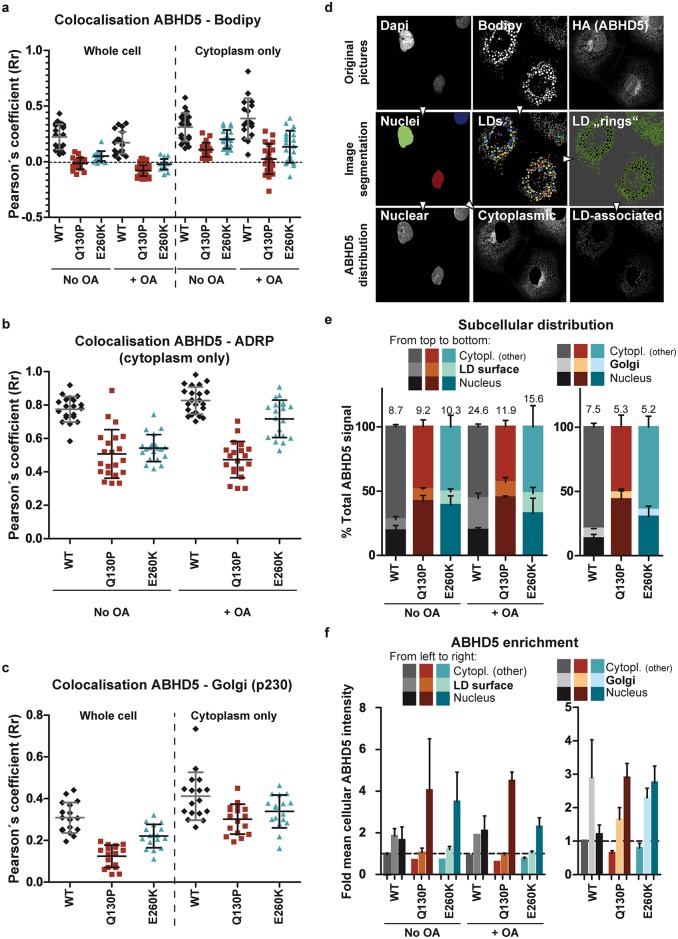
Fig 5. ABHD5 mutants accumulate in the nucleus and poorly associate with lipid droplets.
Experimental details and representative immunofluorescence pictures are to be found in Figs 3, 4 and S4. For each analysis, the data were averaged over 2 independent experiments and at least 10 (ADRP, Bodipy) or 7 frames (Golgi) per experiment. (a-c) Pearson’s correlation coefficient (Rr) between HA-tagged ABHD5 and lipid droplet (a, b) or trans-Golgi markers (c) were calculated on the whole cells or specifically on the cytoplasm, as indicated. Note that the correlation with the ADRP marker was restricted to the cytoplasmic signal to prevent the bias that would have been caused by the diffuse, non-LD-associated, nuclear ADRP signal. Each dot corresponds to one frame. (d-f) Analysis of relative ABHD5 subcellular distribution and enrichment. (d) Cell segmentation strategy: example for the lipid droplet and nucleus segmentation. Within a multichannel picture (Dapi, Bodipy, HA-tagged ABHD5), nuclei and lipid droplets were automatically identified in the respective channels as objects. The lipid droplet periphery was extrapolated as rings of constant thickness around each individual LD. Based on this automated object identification, the ABHD5 signal was then segmented into its nuclear, cytoplasmic and LD-associated fractions. Total and mean intensities in the different cell compartments were measured and normalised to the total or mean ABHD5 intensity in the whole cell, giving the subcellular distribution and enrichment of ABHD5 across these compartments, respectively. A similar strategy was used for the Golgi segmentation (Dapi, p230, HA-tagged ABHD5 triple staining). (e) Subcellular distribution of ABHD5. Left panel: The total ABHD5 signal in the nucleus, at the lipid droplet periphery (LD “rings”) and in the rest of the cytoplasm was quantified and normalised to the total ABHD5 signal. The percentage of LD-associated ABHD5 is indicated on top of each bar. Right panel: A similar analysis was performed on cells stained for the Golgi apparatus instead of the lipid droplets. The percentage of Golgi-associated ABHD5 is indicated on top of each bar. (f) Subcellular enrichment of ABHD5. Left panel: The mean ABHD5 signal intensity in the nucleus, at the lipid droplet periphery (LD “rings”) and in the rest of the cytoplasm was quantified and normalised for the mean ABHD5 signal intensity in the whole cell (set to 1 and highlighted with a dotted horizontal line). Right panel: A similar analysis was performed on cells stained for the Golgi apparatus instead of the lipid droplets.

