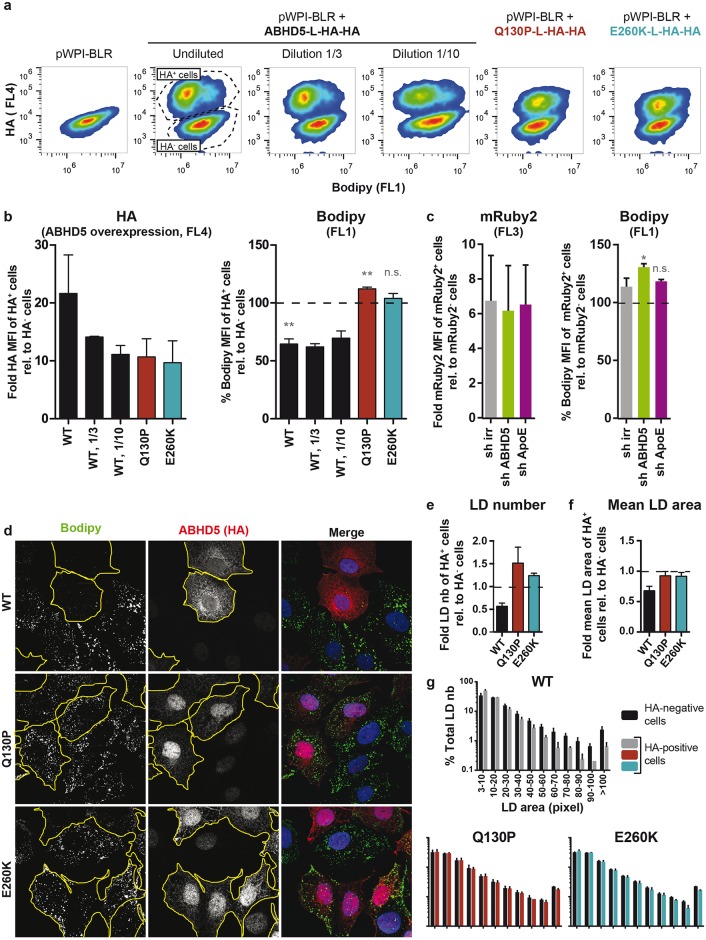
Fig 6. ABHD5 expression regulates the lipid droplet content of the hepatoma cells.
(a-c) FACS readout. (a) Representative FACS plots for the overexpression setup. Lunet N hCD81 cells were mock-transduced (pWPI-BLR) or transduced with an HA-tagged ABHD5 construct. Mock- and ABHD5-transduced cells were mixed and stained for their lipid droplets with the Bodipy dye (FL1, x axis) and for ABHD5 overexpression with an anti-HA antibody (FL4, y axis). Fluorescence at the single cell level was analysed by FACS. The first plot shows the mock-transduced cells alone. The other six plots depict ABHD5-overexpressing cells mixed with mock-transduced cells, which serve each time as an internal reference. The ABHD5-overexpressing cells (top clouds of cells) can easily be distinguished by the HA epitope staining (FL4, y axis). Note, specifically for the wild-type-expressing cells (plots 2 to 4), the shift in the top cloud shape towards lower Bodipy intensities (FL1, x axis). To reach similar expression levels as compared to the ABHD5 mutants, wild-type ABHD5 construct was transduced with undiluted, 3 fold- or 10 fold-diluted lentiviruses. (b) For each ABHD5 construct, the level of ABHD5 overexpression (left panel) was estimated by the HA mean fluorescence intensity (MFI) of the HA-positive cell population (top cloud of cells) relative to the MFI of the HA-negative cell population (bottom cloud). The lipid droplet content of ABHD5-overexpressing cells (right panel) was estimated by the Bodipy MFI of the HA-positive cells after normalisation with the Bodipy MFI of the HA-negative cells. (c) Knockdown setup. In this setup, cells were transduced simultaneously with the indicated shRNA (sh irr, sh ABHD5, or sh ApoE) and an mRuby2-expressing construct. As in the overexpression setup, each cell population was mixed with mock-transduced cells (irrelevant shRNA + empty pWPI-Puro vector), which served as an internal reference. The expression of mRuby2 allowed distinguishing the 2 cell populations. The mixed cell populations were also stained with Bodipy to assess their lipid droplet content. The fold increase in mRuby2 expression between the shRNA- and mRuby2-transduced cells on one hand and the mock-transduced cells on the other hand is depicted in the left panel. The effect of the shRNA on the lipid droplet content (right panel) was assessed by normalising the Bodipy MFI of the mRuby2-positive cells by the MFI of the mock-transduced cells. (b, c) Averages and standard deviations were calculated over 3 independent experiments. (d-g) Microscopy readout. (d) Representative immunofluorescence pictures. Lunet N hCD81 cells expressing HA-tagged ABHD5 were mixed together with mock-transduced cells and reseeded on coverslips. The next day, cells were fixed and stained for the HA epitope (ABHD5 overexpression), lipid droplets (Bodipy) and nuclei (Dapi). The outline of ABHD5-overexpressing cells was drawn manually and is shown in yellow. Each picture was taken to contain both HA-positive and HA-negative cells so that the mock-transduced cells can serve as an internal control for the subsequent quantifications. (e) Lipid droplet number. Note that in each frame, the number of lipid droplets in HA-negative and HA-positive cell populations was normalised for the total nuclear area of the respective population, as a substitute for the whole cell area. (f) Mean lipid droplet area. (e, f) In each condition (WT / Q130P / E260K), the lipid droplet number and mean area were normalised for those calculated in the mock-transduced cells detected in the same frames. (g) Lipid droplet size distribution. Individual lipid droplets in HA-negative and HA-positive cells were classified in groups depending on their size. For each frame, the number of lipid droplets per size group was normalised by the total number of lipid droplets in the relevant cell population. Note that a lower diameter cut-off value of 2 pixels was used for the lipid droplet identification, so that lipid droplets with an area of less than 3.14 pixels are not detected. For space reasons, the axis labels in the 2 lower panels were not duplicated but are similar as for the WT. (e-g) Averages and standard deviations were calculated over 3 independent experiments and 10 frames per experiment.

