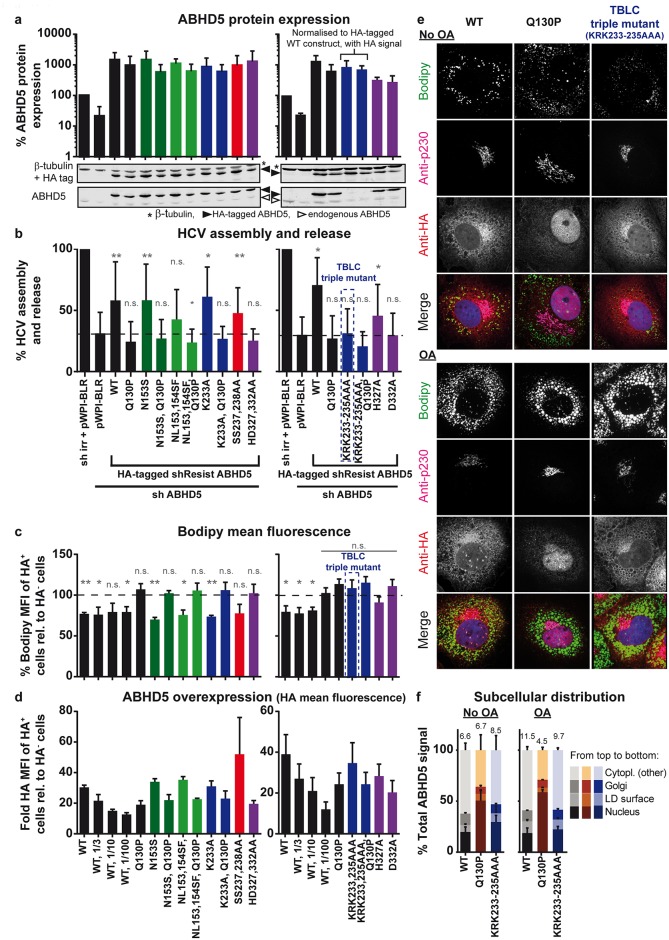
Fig 7. Mapping of ABHD5 determinants responsible for ABHD5 function in lipid metabolism and role in HCV virion production.
ABHD5 functional domains were dissected with a panel of mutants targeting its lipase motif (green), putative NLS (blue), phosphorylation sites (red) and LPAAT motifs (purple) (see Fig 2a). All mutants were cloned with a C-terminal double HA tag. Some mutants were also combined with the Q130P CDS mutation to test for compensatory effects. (a) ABHD5 expression was detected by Western blot at the time of virus harvest with an anti-ABHD5 antibody and with the anti-HA tag antibody. Detection of β-tubulin served as an internal control for protein load. Note that the detection was performed with the Odyssey system, with anti-ABHD5 antibody detected in one channel and both anti-HA and anti-β-tubulin antibodies in the second channel. A representative Western blot is presented in the bottom of each panel while the top part depicts the quantification of ABHD5 expression, normalised for β-tubulin expression and for the mock-treated cells (sh irr and pWPI-BLR transduction) and averaged over the 5 (left panel) or 3 (right panel) independent rescue experiments. Note that in the right panel, the two constructs harbouring a triple mutation of the tribasic motif could not be detected with the anti-ABHD5 antibody. Their expression was therefore measured with the HA tag staining and calculated relatively to the expression of the HA-tagged wild-type construct. (b) Progeny virion production was analysed in the same set of experiments as in panel a (5 or 3 independent experiments for the left and right panels, respectively). Statistically significant differences were tested by comparing the overexpression of the different mutants with the knockdown control (second bar). (c, d) The lipolytic activity of the HA-tagged ABHD5 mutants was analysed by overexpression and with the FACS-based assay described in Fig 6a. Normalised Bodipy signals are plotted in (c) as percentages and the fold increases in HA epitope detection over background are depicted in (d). As in Fig 6, serial dilutions of the WT ABHD5 lentiviruses were included so as to reach expression levels similar to the least expressed mutants. Data show the averages over 3 independent experiments. (e) Lunet N hCD81 cells expressing the HA-tagged ABHD5 TBLC motif mutant or the wild-type or CDS controls were fixed and stained for the HA epitope as well as lipid droplets (Bodipy) and the Golgi (p230) and counterstained with Dapi. Representative pictures of two independent experiments are shown. (f) The subcellular distribution of ABHD5 was analysed as in Fig 5 (but with quadruple staining pictures) for the mutants depicted in panel e, in absence or presence of oleic acid. The numbers on top of each bar correspond to the percentage of LD-associated ABHD5. The data correspond to the average of 2 independent experiments with 10 frames per experiment and construct. (e, f) Note that the complete set of representative immunofluorescence pictures and quantified data covering the entire panel of mutants is available in S10–S12 Figs.

