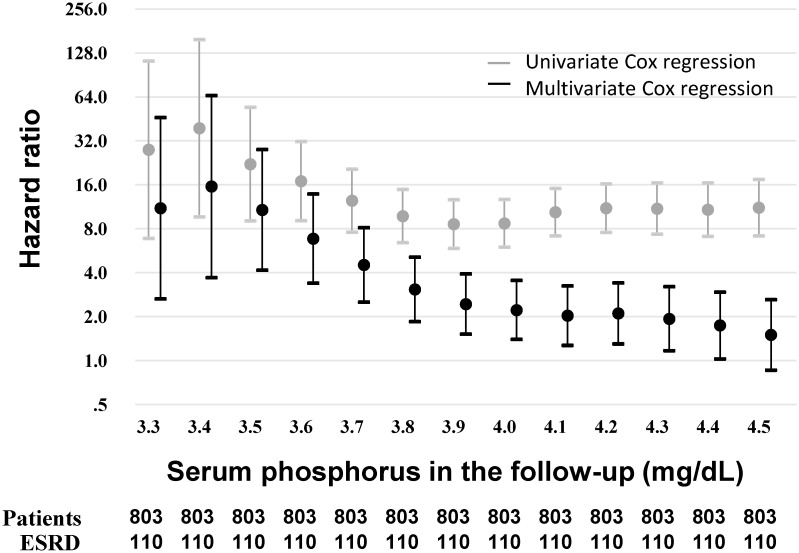
Fig 2. Hazard ratios at the different thresholds of serum phosphorus in the follow-up.
Hazard ratios above versus below the indicated threshold of TA-P was obtained by applying standard Cox proportional hazards models. The total patients (n = 803) were separated at each threshold followed by survival analysis for ESRD as outcome (n = 110). Univariate analysis was performed for a threshold time-average phosphorus as a sole independent covariate. Multivariate analysis was adjusted for the baseline covariates including sex, age, diabetic nephropathy, estimated GFR, albumin, Na-Cl, phosphorus, LDL-C and proteinuria. The multivariate regression analysis showed the significant hazard ratio of higher TA-P up to 4.4 mg/dL. Abbreviation: TA-P, time-averaged phosphorus.

