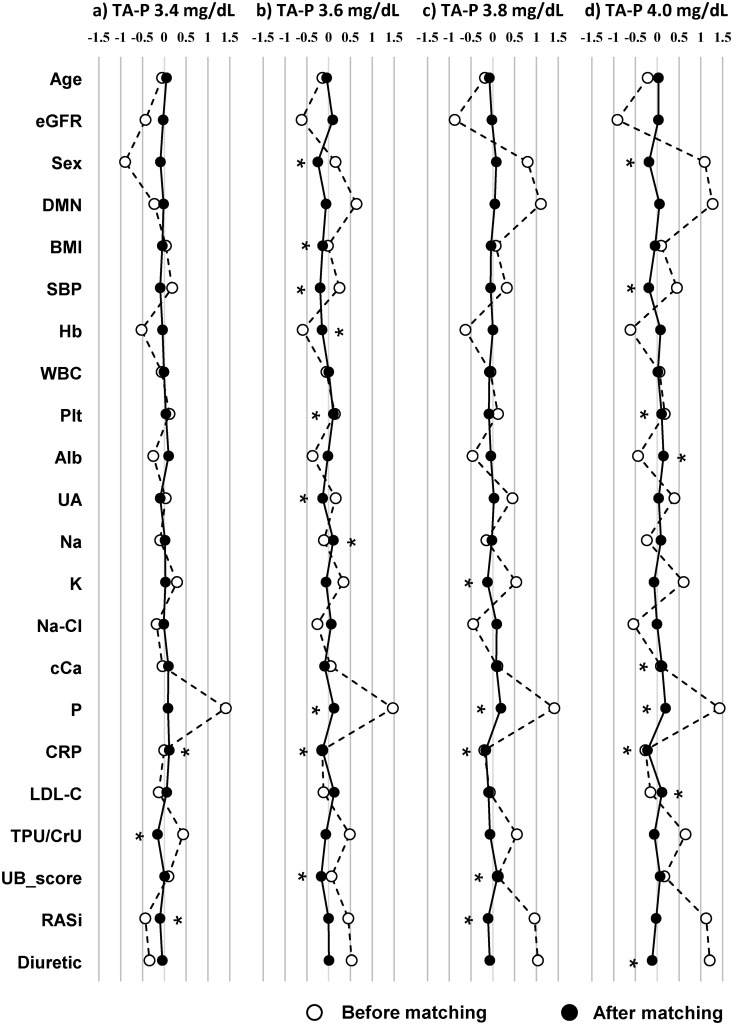
Fig 4. Standardized differences of baseline covariates before and after propensity score matching with different thresholds of serum phosphorus in the follow-up.
a) 3.4 mg/dL, b) 3.6 mg/dL, c) 3.8 mg/dL, d) 4.0 mg/dL of serum phosphorus in the follow-up. Standardized differences below 0.1 are recognized as good balance between two groups. Covariates which did not reach below 0.1 is indicated by asterisk (*). Abbreviations: TA-P, time-averaged phosphorus; eGFR, estimated glomerular filtration rate; DMN, diabetic nephropathy; BMI, body mass index; SBP, systolic blood pressure; Hb, hemoglobin; WBC, white blood cell; Plt, platelet; Alb, albumin; UA, uric acid; Na, sodium; K, potassium; Cl, chloride; cCa, albumin-corrected calcium; P, phosphorus; CRP, C reactive protein; LDL-C, low-density lipoprotein cholesterol; TPU/CrU, urine total protein divided by urine creatinine; UB_score, urine blood score; RASi, RAS inhibitor.

