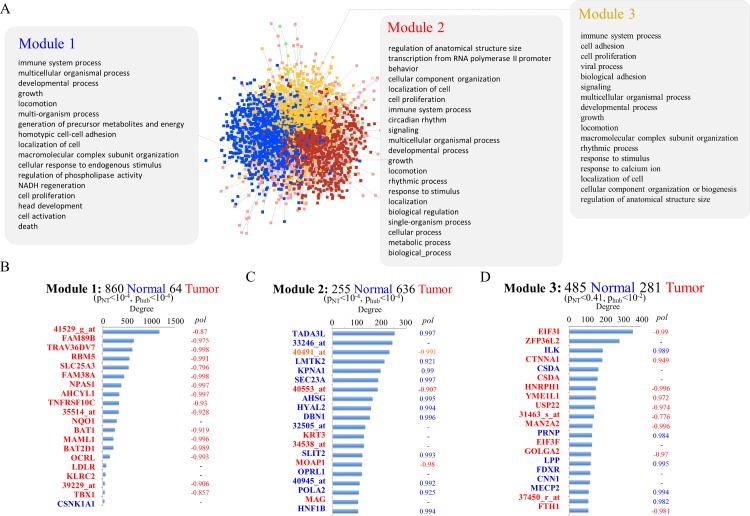
Fig 2. Co-expression network linking normal and tumour epithelial cells.
The figures represent the modularized NT network with the results of the network connectivity and functional enrichment analysis. (A) The NT network in which genes belonging to the three main modules have been color-coded. The main functional terms identified by the web-based tool G:Profiler are listed in the three panels connected to each module. (B-D) The number of connections of the top 20 most connected hubs in each module. The x axis represents the number of connections, genes are represented on the y axis and color-coded to represent the cell type where they are expressed (blue and red represent normal and tumour epithelial cells respectively). Below each heading two p values are listed. pNT is the p value from a test showing the probability that the proportion of normal/tumour expressed genes in each module is the result of random chance. phub is the p value from the test showing the probability that the proportion of normal/tumour expressed genes in the top 20 hubs is the result of random chance.

