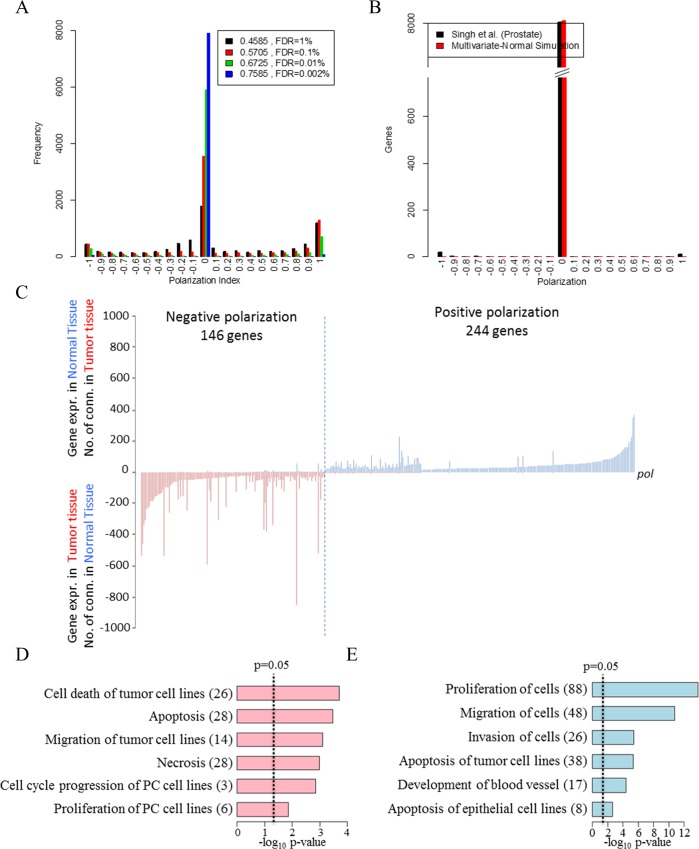
Fig 3. Analysis of the NT network using a novel topological index.
The results of the analysis of the NT network using the polarization index. (A) The distribution of polarization coefficient for 4 different significance thresholds defying the NT network. (B) The same distribution from a multi-variate normal model that generates random datasets with similar distributions of correlation coefficients for the normal and tumour tissue but no constrains on the correlation structure between the two tissues. (C) The number of connections towards normal or tumour expressed genes for each of the selected (rs>|0.75|) polarized genes. The x-axis represent the polarized genes sorted by increasing values of polarization index. The y-axis shows the number of tumour-expressed genes correlated to each polarized gene when expressed in normal tissue (positive values) and the number of normal expressed genes correlated to each polarized gene when expressed in tumour tissue (negative values). (D-E) The number of genes and significance (x axis) for the most enriched functional terms in the negative and positively polarized genes respectively.

