
Figure 2.
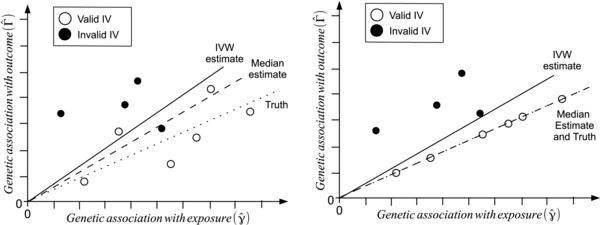
Fictional example of a Mendelian randomization analysis with 10 genetic variants–six valid instrumental variables (hollow circles) and four invalid instrumental variables (solid circles) for finite sample size (left) and infinite sample size (right) showing IVW (solid line) and simple median (dashed line) estimates compared with the true causal effect (dotted line). The ratio estimate for each genetic variant is the gradient of the line connecting the relevant datapoint for that variant to the origin; the simple median estimate is the median of these ratio estimates.