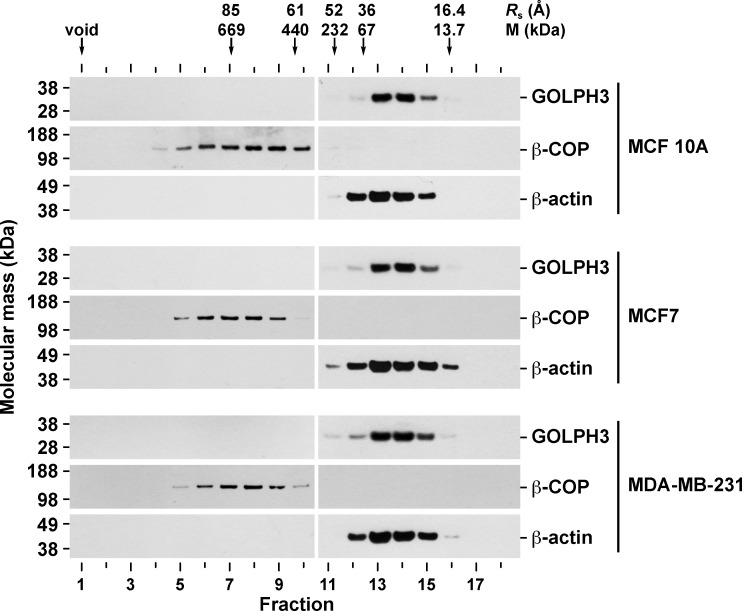
Fig 3. Cytosolic GOLPH3 behaves as a monomer in MCF 10A, MCF7, and MDA-MB-231 cells.
Samples of a cytosolic fraction from the indicated cell lines were analyzed by gel filtration on a Superose 6 column. Arrows indicate the elution position of molecular size markers. Stokes radii (Rs) are indicated in Angstroms (Å). As a reference, the molecular mass (M) of molecular size markers is also indicated. Fractions were subjected to SDS-PAGE and immunobloting with antibodies to the proteins indicated on the right. The position of molecular mass markers is indicated on the left.

