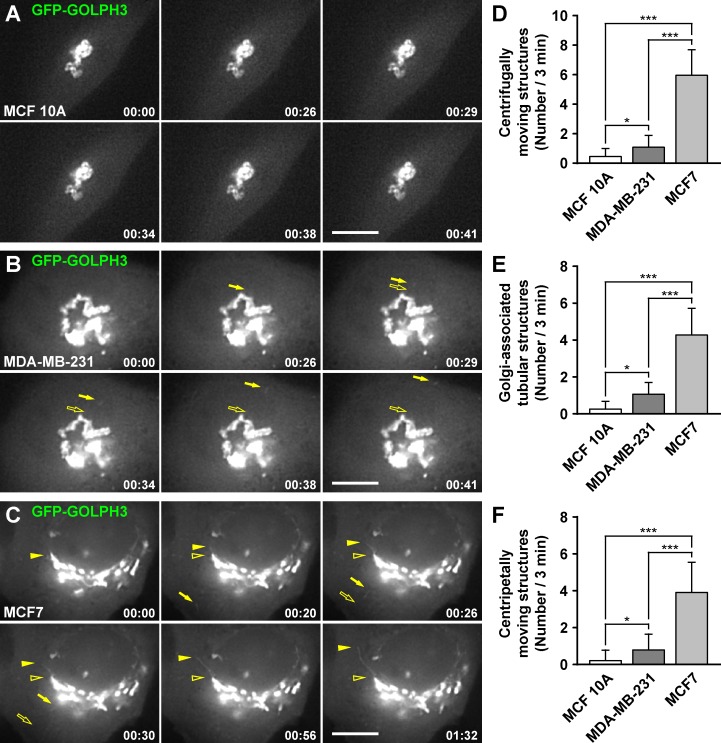
Fig 5. The dynamic behavior of GFP-GOLPH3 is different in different human breast cell lines.
(A-C) MCF 10A (A), MDA-MB-231 (B), and MCF7 (C) cells transiently expressing GFP-GOLPH3 were held in a microscope stage at 37°C and examined by fluorescence microscopy. The time after initiation of imaging is shown in the bottom right corner of each panel in minutes:seconds. Images are representative of 15–20 videos of up to 200 seconds of recording. In B, filled arrows indicate a vesicular structure moving from the Golgi to the periphery of the cell. In C, filled arrows indicate a vesicular structure moving from the periphery of the cell to the Golgi area, and filled arrowheads indicate a tubular structure elongating from the Golgi. Empty arrows and empty arrowheads indicate the initial position of mobile structures. Bars, 5 μm. (D-F) The number of tubule-vesicular structures moving centrifugally (D), the number of tubular structures elongating from the Golgi (E), or the number of tubule-vesicular structures moving centripetally (F), were quantified from videos corresponding to 180 seconds of imaging. Bar represents the mean + standard deviation of the observed profiles (n = 15). * P < 0.05; *** P < 0.001.

