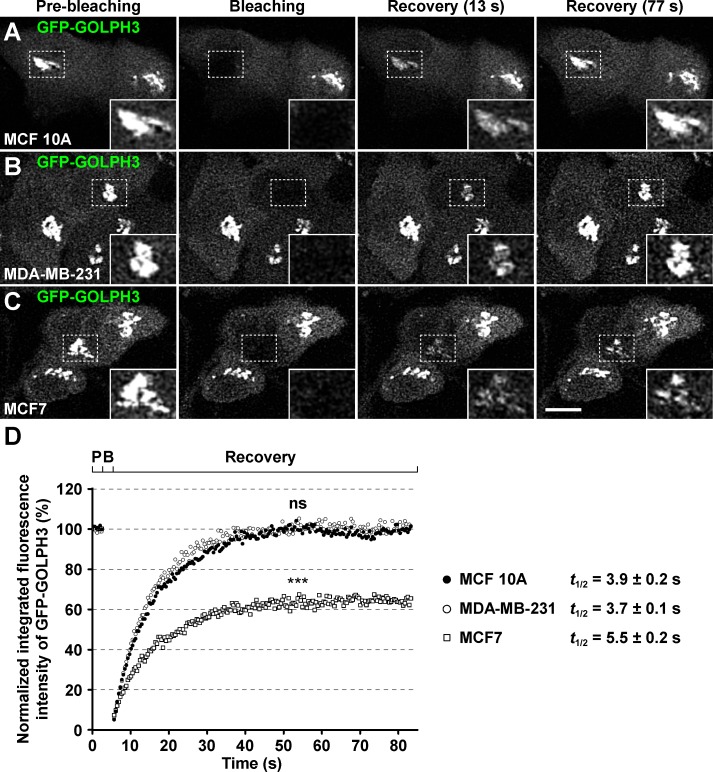
Fig 6. The Golgi-associated fluorescence after photobleaching of GFP-GOLPH3 recovers partially in MCF7 cells.
(A-C) MCF 10A (A), MDA-MB-231 (B), and MCF7 (C) cells transiently expressing GFP-GOLPH3 were held in a microscope stage at 37°C. The area indicated by a white dotted-line rectangle in each set of images was bleached with a 488-nm laser set to 100% power. The fluorescence recovery after photobleaching (FRAP) was tracked by laser confocal microscopy with the 488-nm laser set to 2% power. Images were acquired before bleaching (Pre-bleaching), immediately after bleaching (Bleaching), and during the recovery of the fluorescence (Recovery) at approximately every 0.4-sec. Images of a representative experiment performed on each cell line are shown in each set of panels. Two images of the recovery of fluorescence are depicted with the time indicated in parenthesis in seconds. Bar, 10 μm. (D) Plot of the FRAP analysis of GFP-GOLPH3 in MCF 10A (black circles; n = 10), MDA-MB-231 (white circles; n = 10), and MCF7 (white squares; n = 10) cells. P, pre-bleaching; B; bleaching. For simplicity, error bars are not depicted. *** P < 0.001; ns, not statistically significant. The halftime (t1/2) of maximal fluorescence recovery is indicated on the right in seconds (s).

