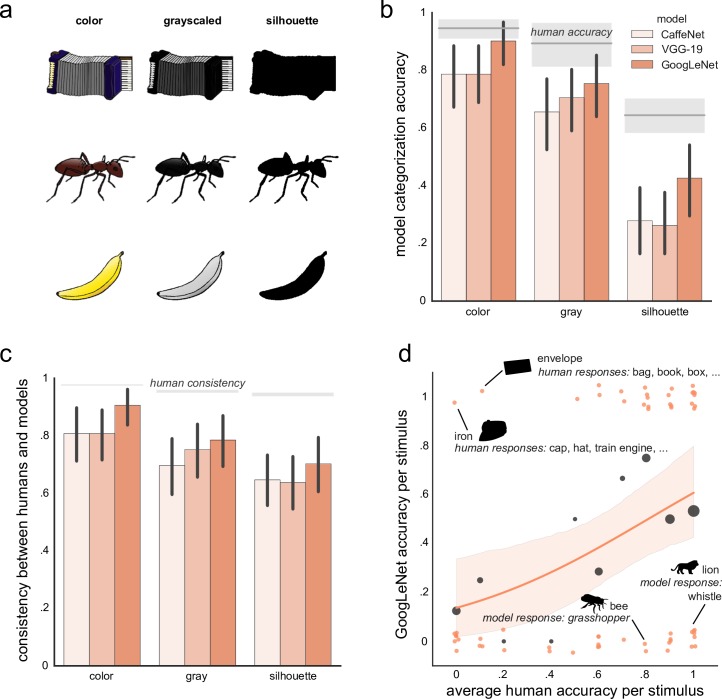
Fig 1. Object categorization.
(a) Examples of stimuli from the modified Snodgrass and Vanderwart stimulus set [21]. Stimulus images courtesy of Michael J. Tarr, Center for the Neural Basis of Cognition and Department of Psychology, Carnegie Mellon University, http://www.tarrlab.org/. (b) Human (n = 10 for each variant of the stimulus set) and convnet (CaffeNet, VGG-19, GoogLeNet) accuracy in naming objects. For each stimulus set variant, mean human performance is indicated by a gray horizontal line, with the gray surrounding band depicting 95% bootstrapped confidence intervals. Error bars on model performance also depict 95% bootstrapped confidence intervals. (c) A consistency between human and convnet naming of objects. A consistency of .5 means that about half of responses (whether correct or not) we consistent between a model and an average of humans. Error bars indicate 95% bootstrapped confidence intervals. Gray bands indicate estimated ceiling performance based on between-human consistency. (d) Correlation with human performance on the silhouette stimulus set. The x-axis depicts an average human accuracy for a particular silhouette [15] and the y-axis depicts GoogLeNet performance on the same silhouette (either correct (value 1.0) or incorrect (value 0.0)). Model’s performance is jittered on the x- and y-axis for better visibility. Dark gray bubbles indicate average model’s performance for 11 bins of human performance (i.e., 0–5%, 5–15%, 15–25%, etc.) with the size of each bubble reflecting the number of data points per bin. The orange line shows the logistic regression fit with a 95% bootstrapped confidence interval (light orange shaded). The slope of the logistic regression is reliably different from zero.

