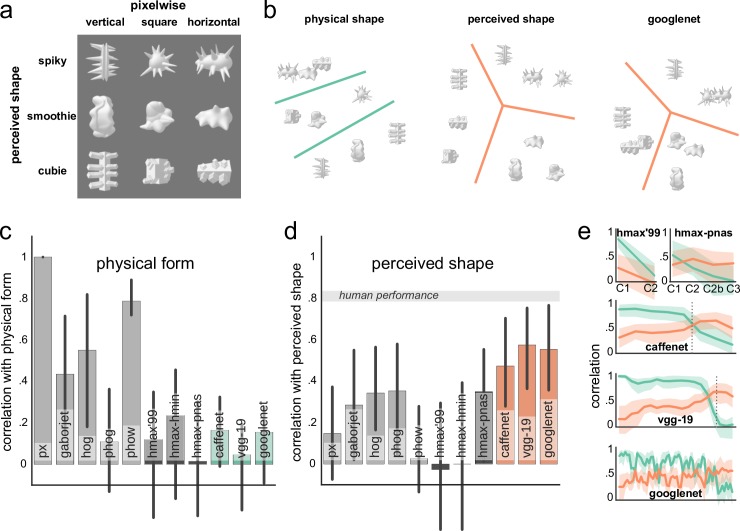
Fig 2. Model preference for shape.
(a) Stimulus set with physical and perceived shape dimensions manipulated orthogonally [5]. (b) Multidimensional scaling plots for the dissimilarity matrices of physical form, perceived shape, and the GoogLeNet outputs (at the top layer). The separation between shapes based on their perceived rather than physical similarity is evident in the GoogLeNet outputs (for visualization purposes, indicated by the lines separating the three clusters). (c) A correlation between model outputs and the physical form similarity of stimuli. Most shallow models are capturing physical similarity reasonably well, whereas HMAX and deep models are largely less representative of the physical similarity. (d) A correlation between model outputs and the perceived shape similarity of stimuli. Here, in contrast, deep models show a tendency of capturing perceived shape better than shallow and HMAX models. Gray band indicates estimated ceiling correlation based on human performance. (e) Correlation with physical (green) and perceived (orange) shape similarity across the layers of HMAX models and convnets. A preference for the perceived shape emerges in the upper layers. Vertical dotted lines indicate where fully-connected layers start. In all plots, error bars (or bands) indicate the 95% bootstrapped confidence intervals.

